
Fig. 2: Universal inequality in the production of US-trained faculty.
From: Quantifying hierarchy and dynamics in US faculty hiring and retention
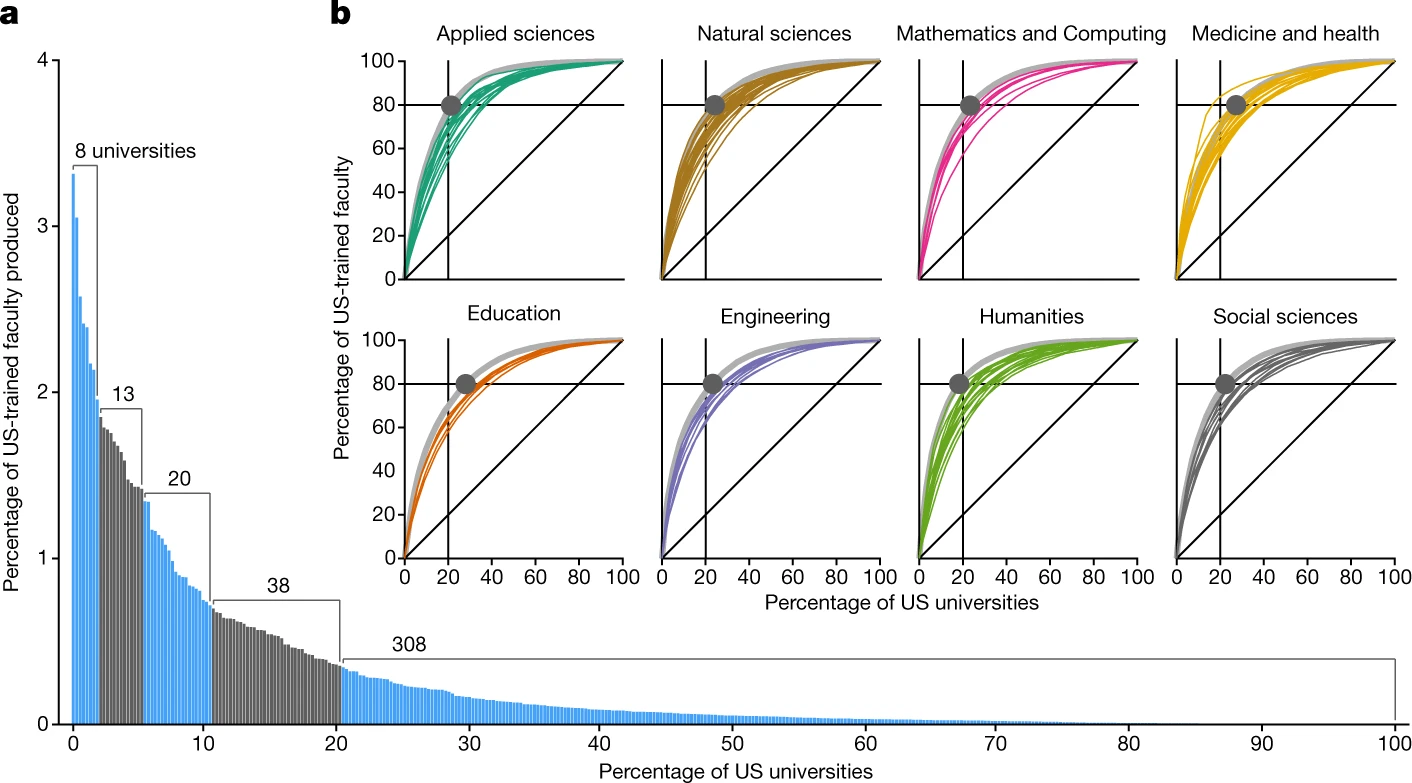
a, Proportions of US faculty produced by US universities, sorted by production rank, with the university producing the most faculty having a rank of 1 (n = 238,676 faculty; n = 387 universities). Quintiles of production are highlighted with alternating colours and annotated with the number of universities falling within each. By production, the first quintile contains only eight universities and the bottom contains 308. b, Lorenz curves for faculty production at the field level (coloured lines) and at the domain level (grey lines). A point is placed at the site along the domain-level Lorenz curve where 80% of faculty have been produced.
