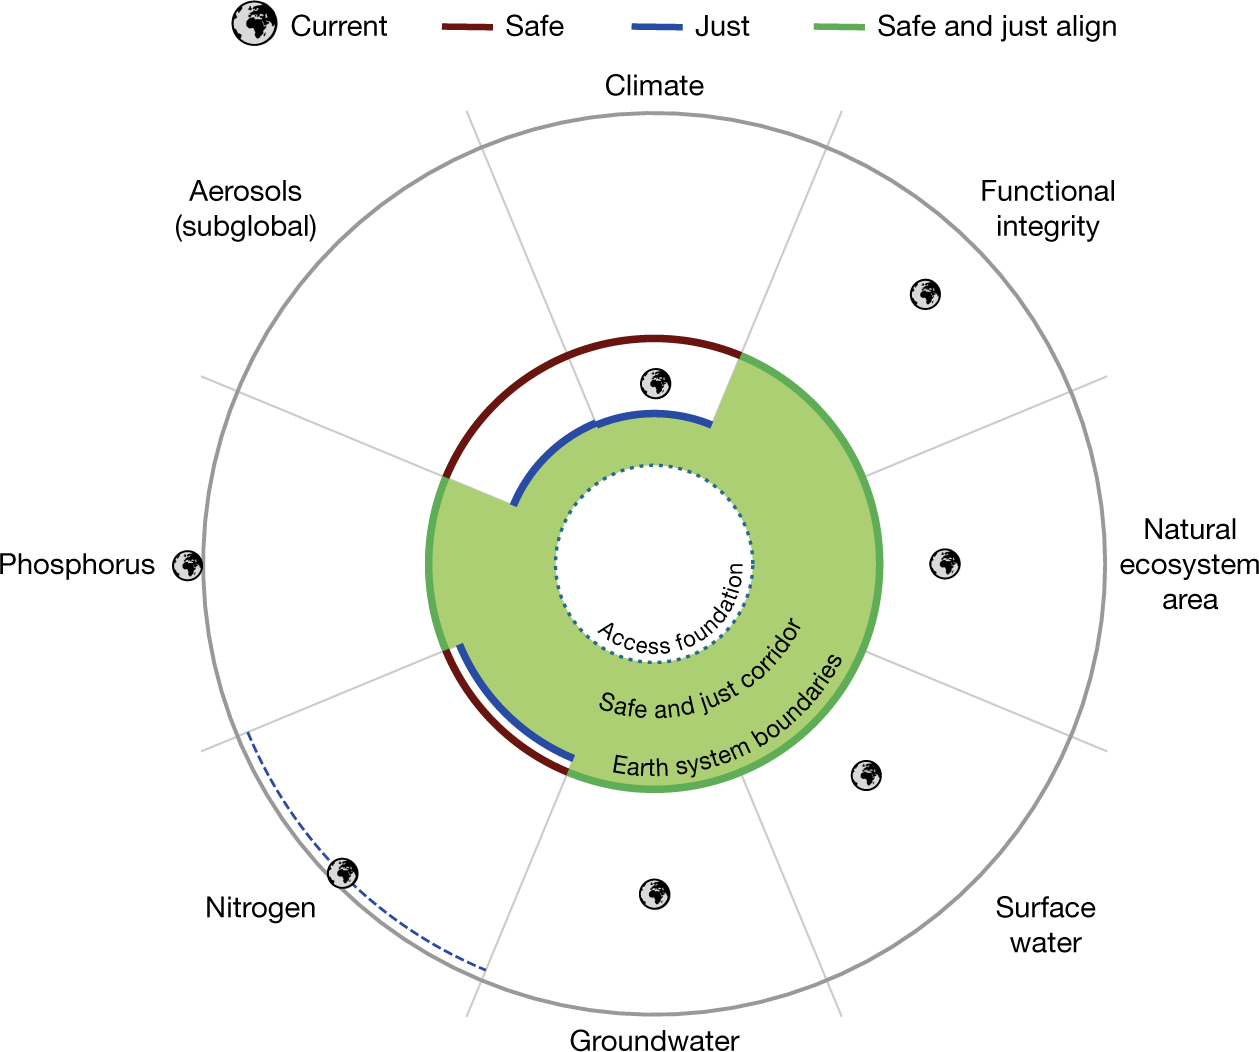
Fig. 1: Proposed safe and just (NSH) ESBs.

Visualization of safe ESBs (dark red), just (NSH) ESBs (blue), cases where safe and just (NSH) boundaries align (green) and current global states (Earth icons). Radial axes are normalized to safe ESBs. Headline or central estimate global boundaries (Table 1) are plotted to support comparison with the current global state, but we emphasize that we have also defined subglobal boundaries and multiple likelihood levels for many domains (Table 1). For aerosols, however, we display the subglobal boundaries to compare safe and just boundaries. For nitrogen, we plot with a dashed blue line the boundary quantification for harm from nitrate in groundwater while noting that the just boundary must also incorporate safe considerations via eutrophication, leading to a more stringent safe and just boundary. Minimum access to water, food, energy and infrastructure for all humans (dotted green line) could constitute the foundation of a safe and just ‘corridor’ (green filled area), but we do not quantify this foundation here. Alternative visualizations are presented in Extended Data Fig. 1.
