
Extended Data Fig. 1: Alternative visualizations of safe and just Earth system boundaries (Fig. 1).
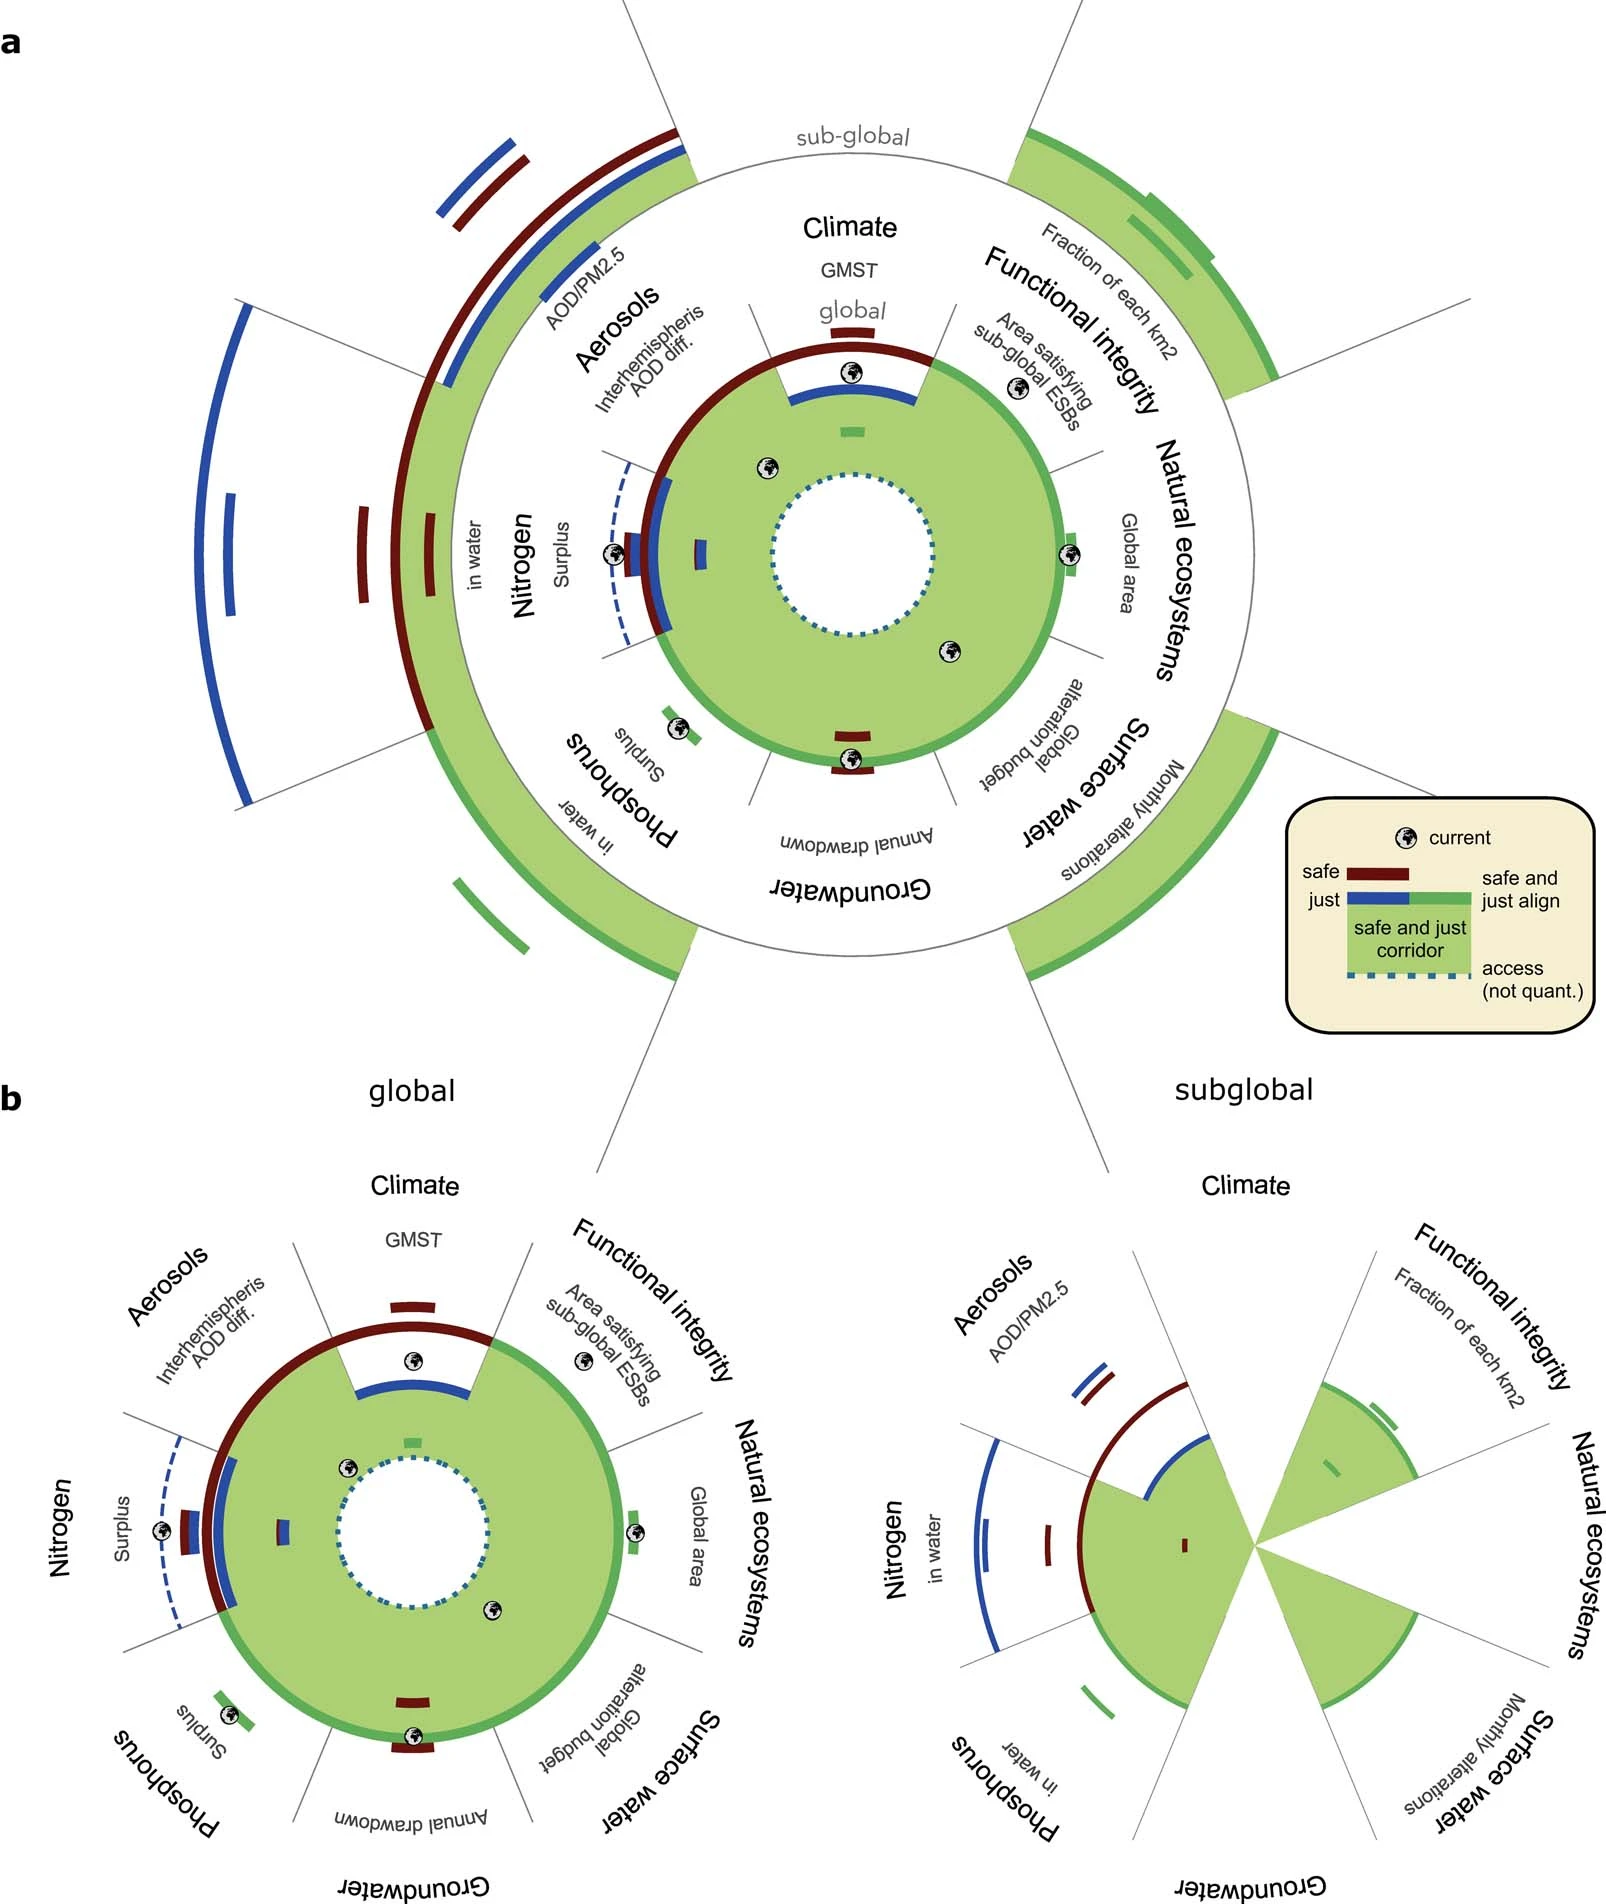
Concentric (a) and parallel (b) visualizations of global (a, inner circle; b, left circle) and sub-global (a, outer circle; b, right circle) safe and just ESBs. Colours are as in Fig. 1. Global rings (a, inner circle; b, left circle) show current global states; a single current state cannot be defined sub-globally. Short concentric lines (that extend across less than the full width of a wedge) represent alternative likelihood levels (safe) or levels of exposure (just NSH) (Table 1).
