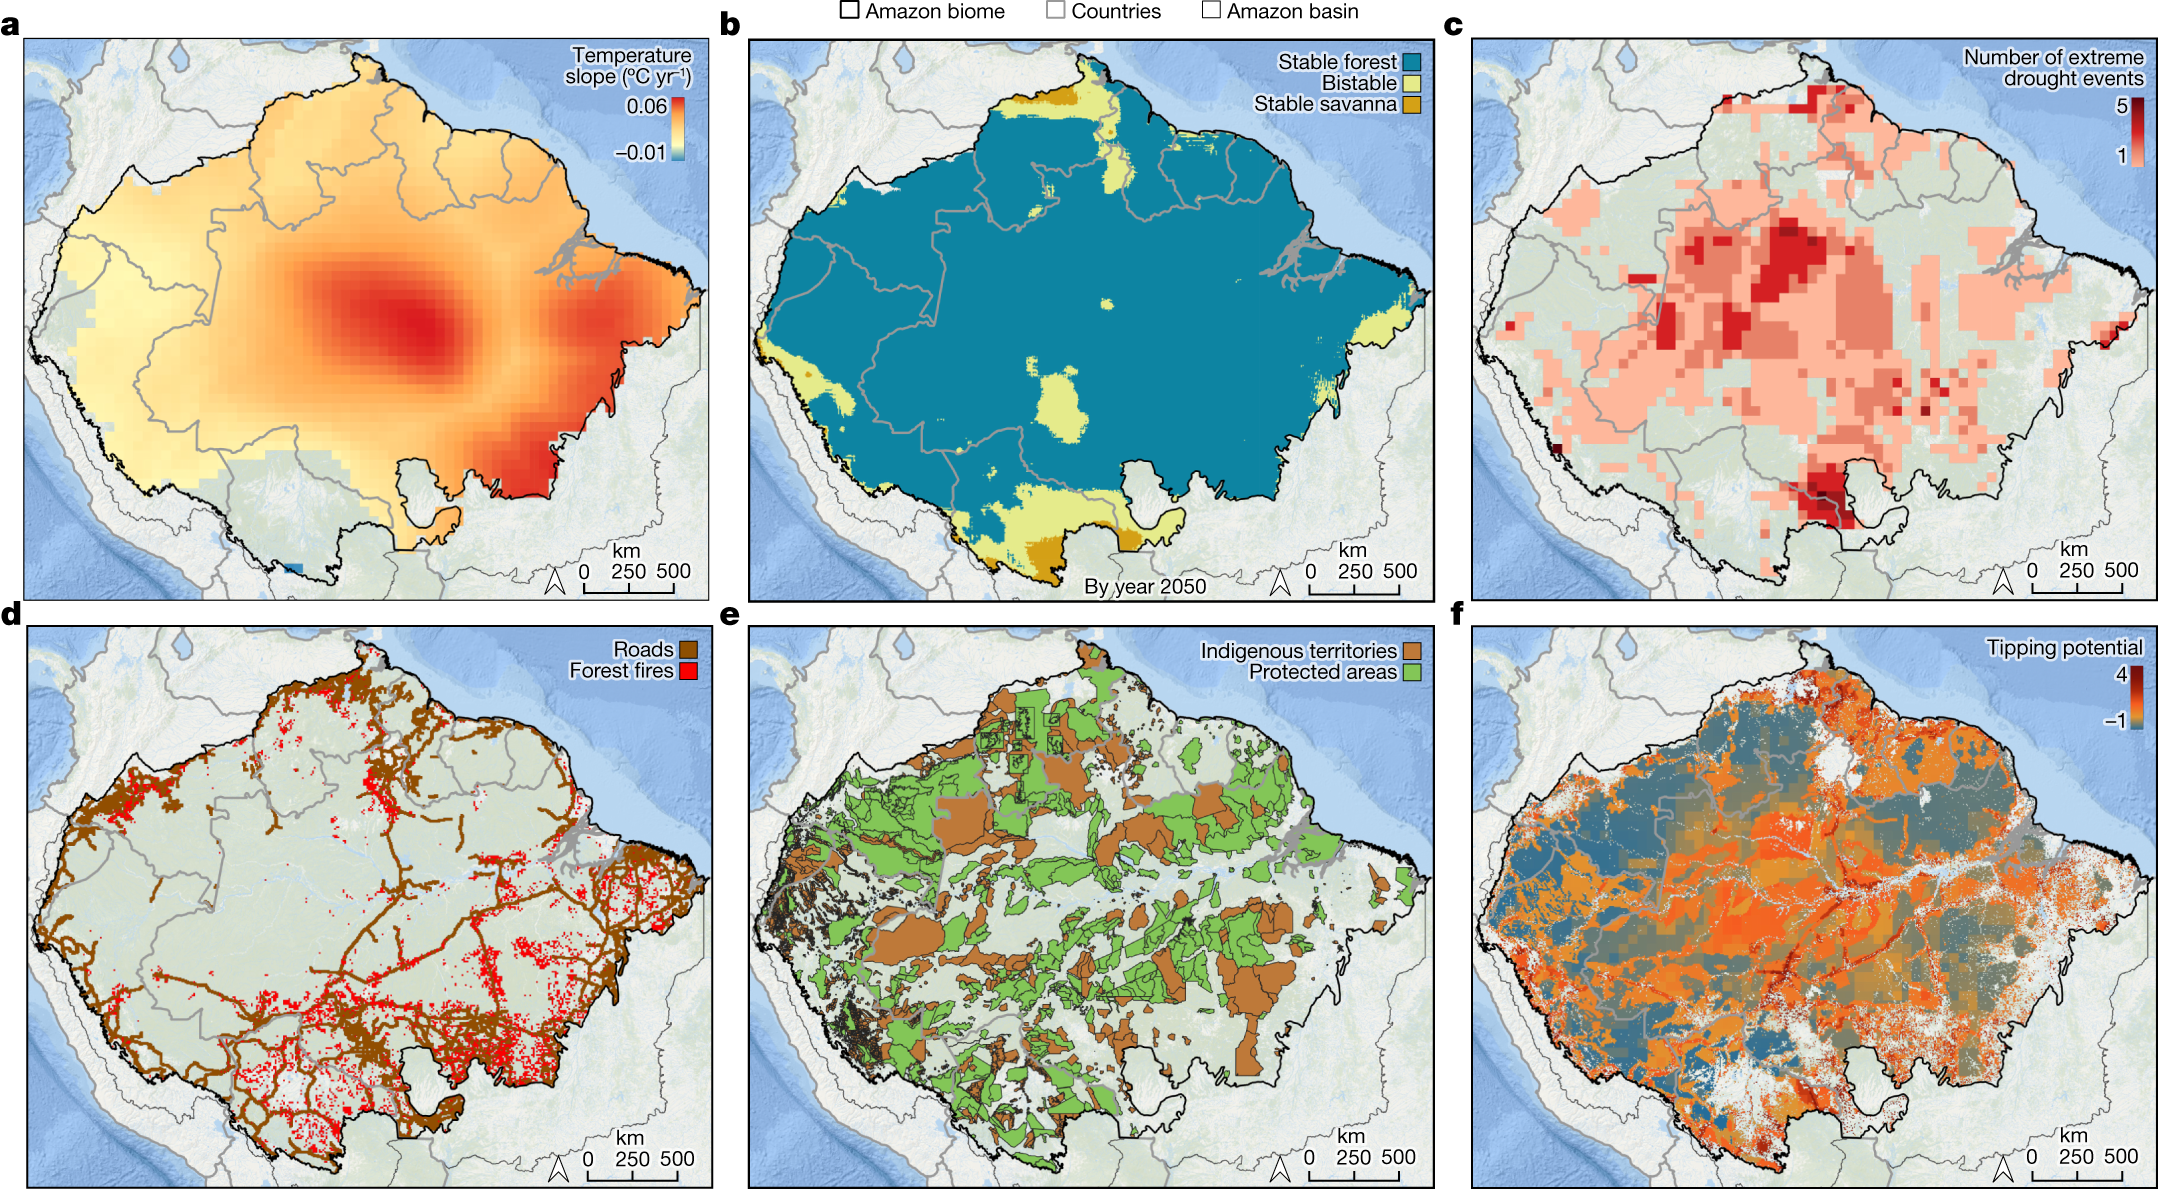
Fig. 1: Exploring ecosystem transition potential across the Amazon forest biome as a result of compounding disturbances.

a, Changes in the dry season (July–October) mean temperature reveal widespread warming, estimated using simple regressions between time and temperature observed between 1981 and 2020 (with P < 0.1). b, Potential ecosystem stability classes estimated for year 2050, adapted from current stability classes (Extended Data Fig. 1b) by considering only areas with significant regression slopes between time and annual rainfall observed from 1981 through 2020 (with P < 0.1) (see Extended Data Fig. 3 for areas with significant changes). c, Repeated extreme drought events between 2001–2018 (adapted from ref. 39). d, Road network from where illegal deforestation and degradation may spread. e, Protected areas and Indigenous territories reduce deforestation and fire disturbances. f, Ecosystem transition potential (the possibility of forest shifting into an alternative structural or compositional state) across the Amazon biome by year 2050 inferred from compounding disturbances (a–d) and high-governance areas (e). We excluded accumulated deforestation until 2020 and savannas. Transition potential rises with compounding disturbances and varies as follows: less than 0 (in blue) as low; between 1 and 2 as moderate (in yellow); more than 2 as high (orange–red). Transition potential represents the sum of: (1) slopes of dry season mean temperature (as in a, multiplied by 10); (2) ecosystem stability classes estimated for year 2050 (as in b), with 0 for stable forest, 1 for bistable and 2 for stable savanna; (3) accumulated impacts from extreme drought events, with 0.2 for each event; (4) road proximity as proxy for degrading activities, with 1 for pixels within 10 km from a road; (5) areas with higher governance within protected areas and Indigenous territories, with −1 for pixels inside these areas. For more details, see Methods.
