
Fig. 2: Gene mutation prediction.
From: A whole-slide foundation model for digital pathology from real-world data
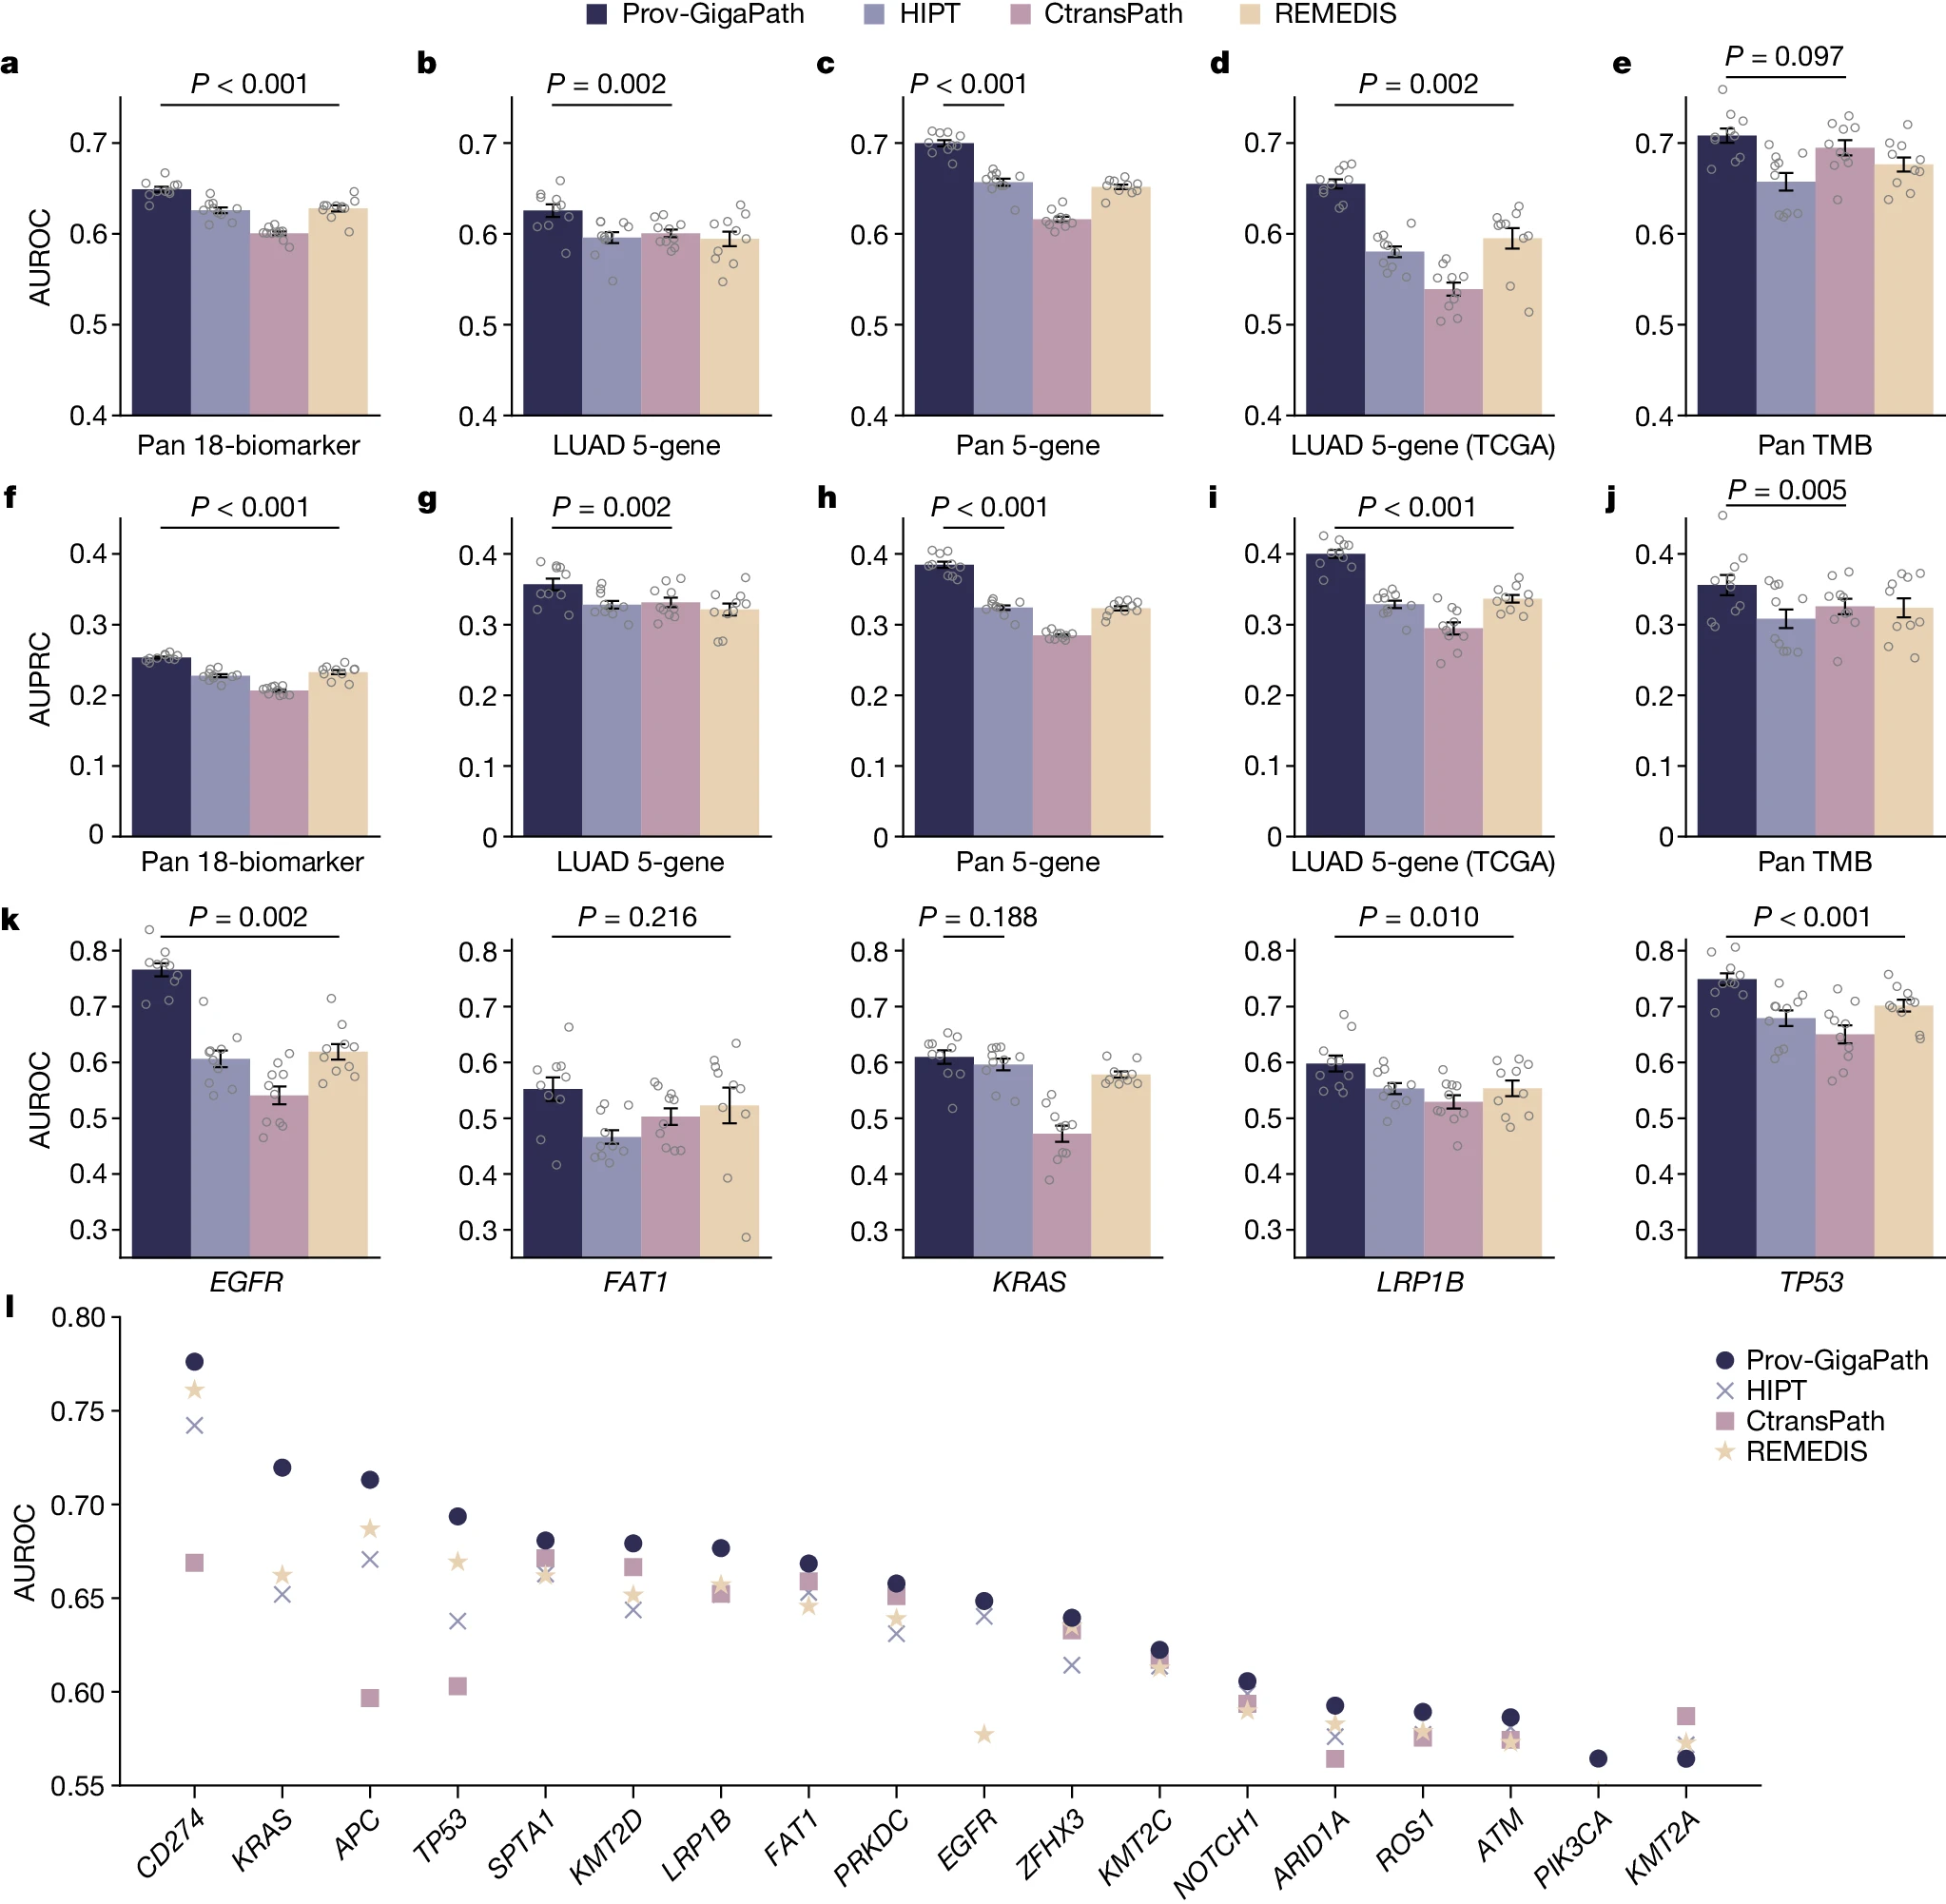
a−j, Bar plots comparing the AUROC and AUPRC scores of Prov-GigaPath and competing methods on pan-cancer 18-biomarker (a,f), LUAD-specific 5-gene mutation prediction (b,g), pan-cancer 5-gene mutation prediction (c,h), LUAD-specific 5-gene mutation prediction on TCGA (d,i) and pan-cancer TMB prediction (e,j). k, Bar plot showing AUROC for each gene on LUAD-specific five-gene mutation prediction on TCGA. a−k, Data are mean ± s.e.m. across n = 10 independent experiments. The listed P value indicates the significance for Prov-GigaPath outperforming the best comparison approach, with one-sided Wilcoxon test. l, Comparison of AUROC scores for individual biomarkers in pan-cancer 18-biomarker predictions.
