
Fig. 4: Comparison on image–report alignment.
From: A whole-slide foundation model for digital pathology from real-world data
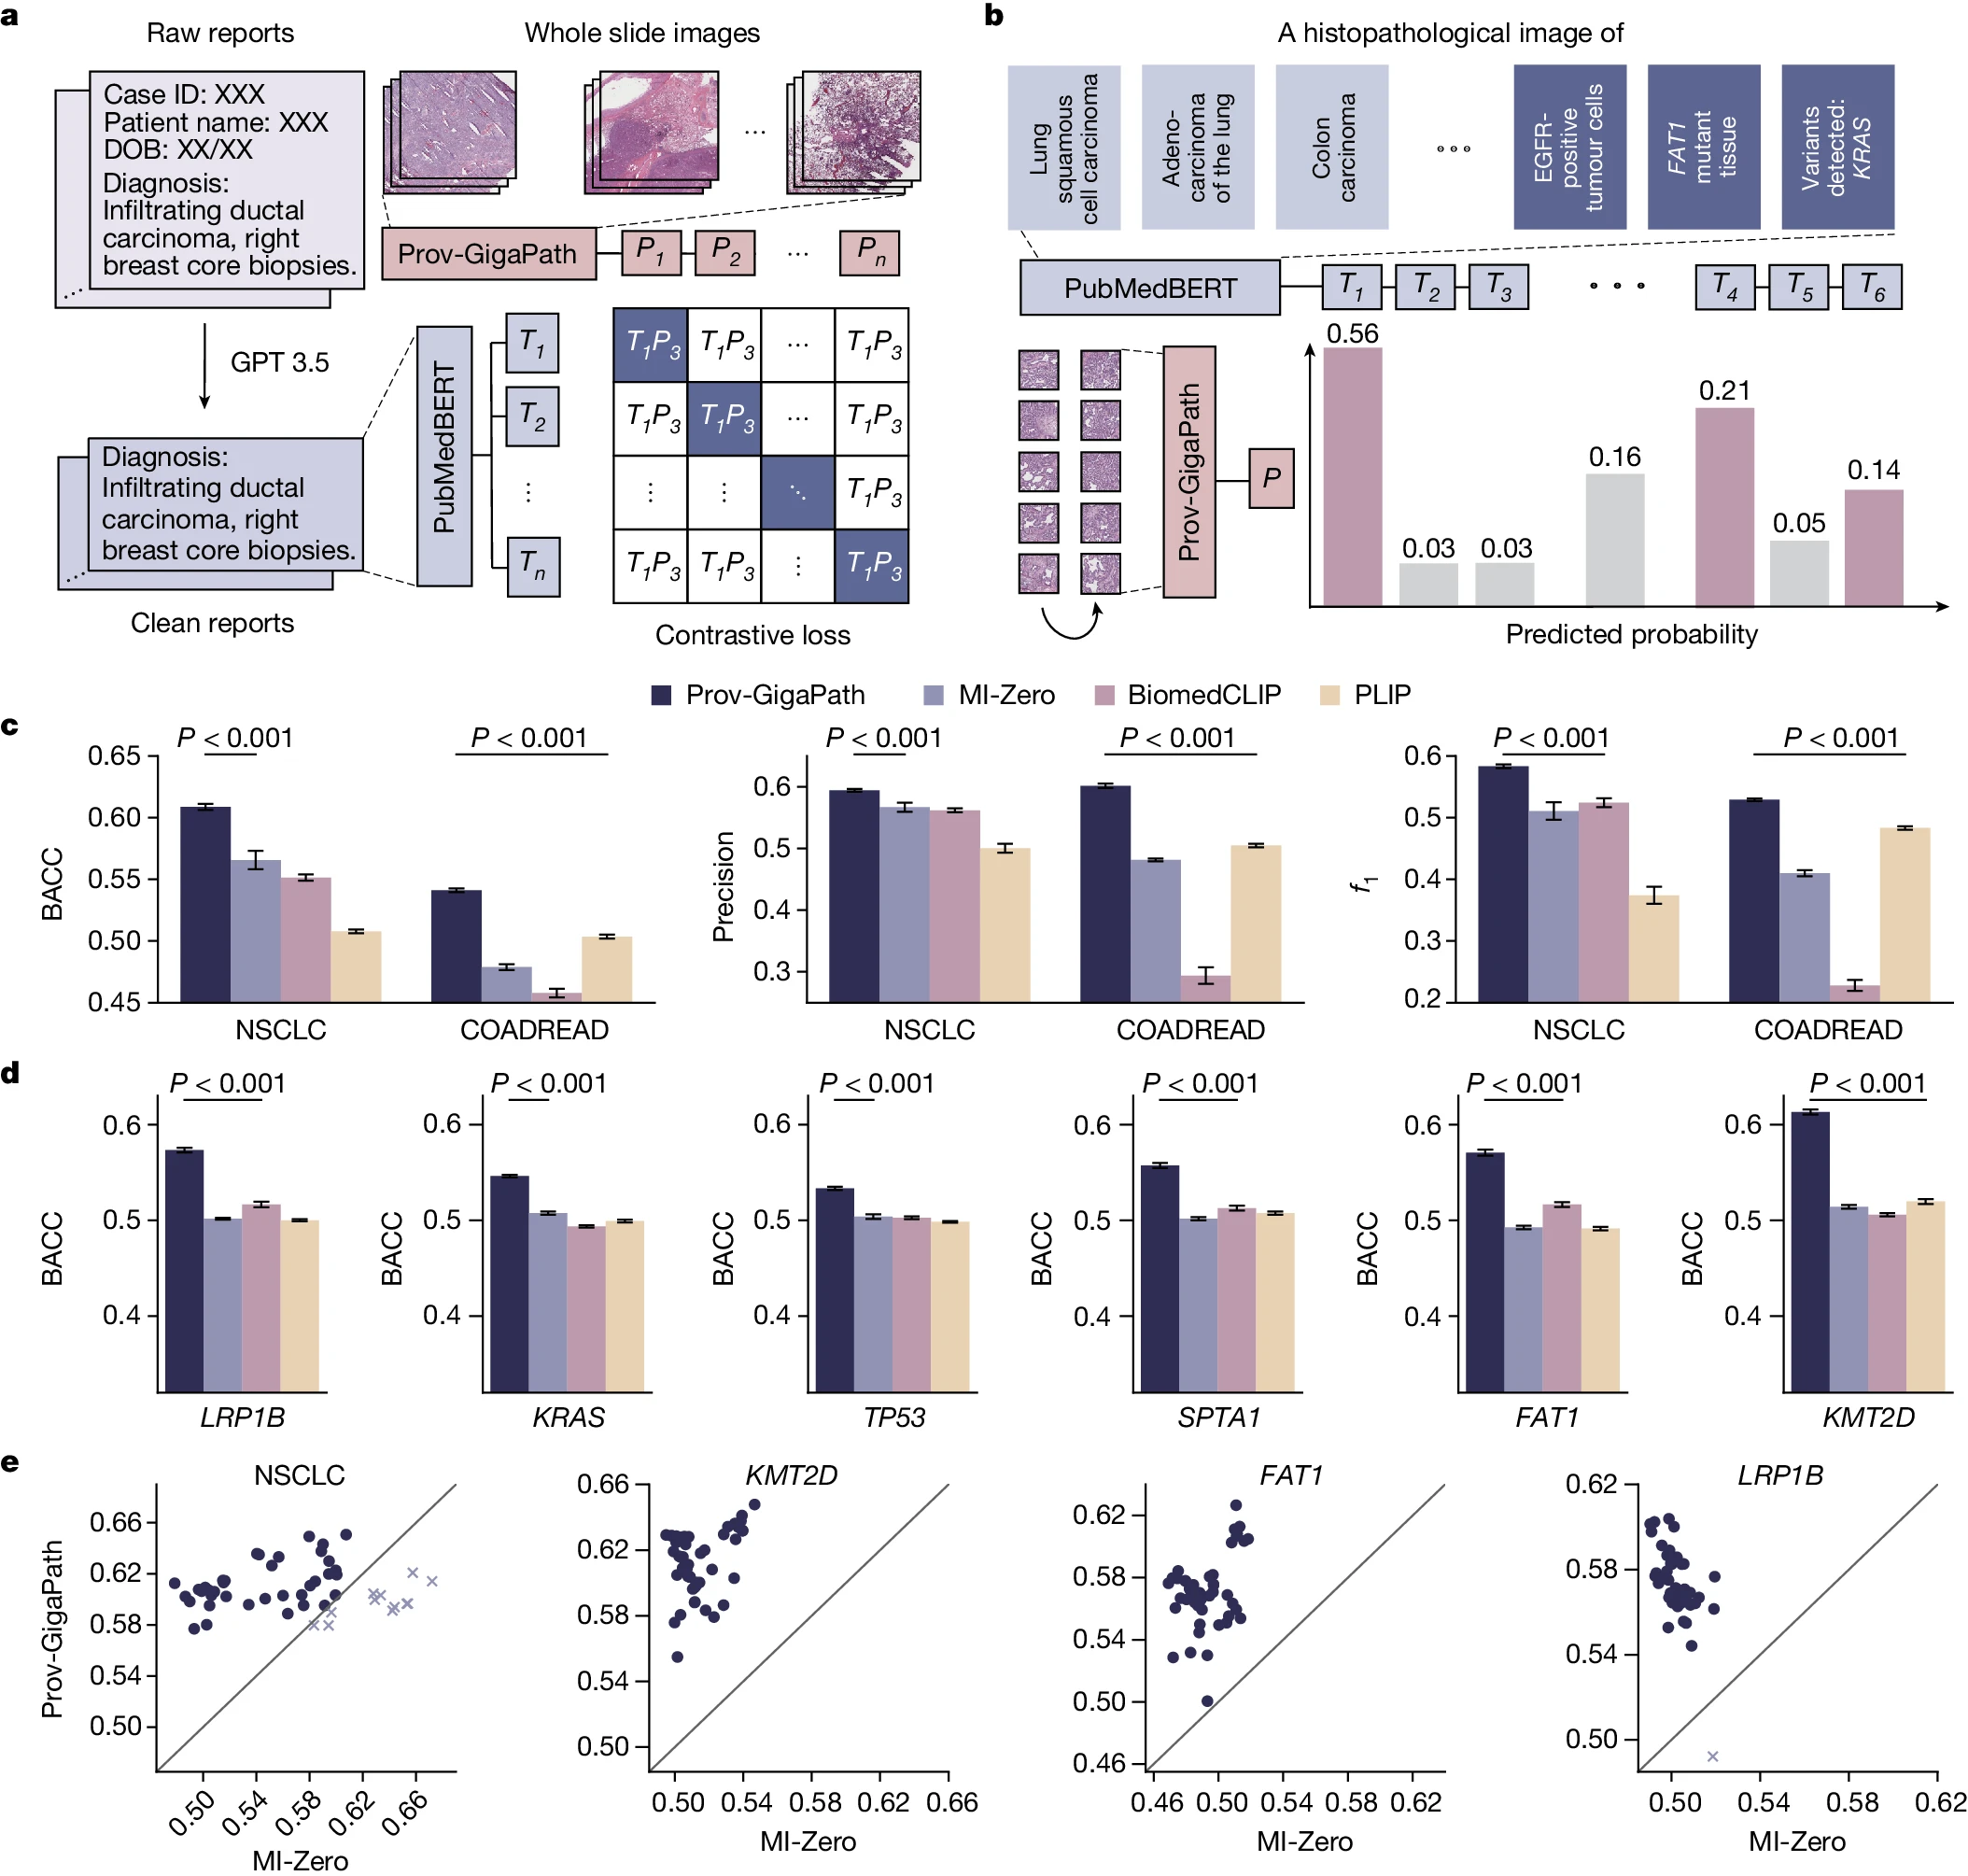
a, Flow chart showing the fine-tuning of Prov-GigaPath using pathology reports. Real-world pathology reports are processed using GPT-3.5 from OpenAI to remove information irrelevant to cancer diagnosis. We performed the CLIP-based contrastive learning to align Prov-GigaPath and PubMedBERT. b, The fine-tuned Prov-GigaPath can then be used to perform zero-shot cancer subtyping and mutation prediction. The input of Prov-GigaPath is a sequence of tiles segmented from a WSI, and the inputs of the text encoder PubMedBERT are manually designed prompts representing cancer types and mutations. Based on the output of Prov-GigaPath and PubMedBERT, we can calculate the probability of the input WSI being classified into specific cancer subtypes and mutations. c, Bar plots comparing zero-shot subtyping performance on NSCLC and COADREAD in terms of BACC, precision and f1. d, Bar plots comparing the performance on mutation prediction using the fine-tuned model for six genes. c,d, Data are mean ± s.e.m. across n = 50 experiments. The listed P value indicates the significance for Prov-GigaPath outperforming the best comparison approach, with one-sided Wilcoxon test. e, Scatter plots comparing the performance between Prov-GigaPath and MI-Zero in terms of BACC on zero-shot cancer subtyping. Each dot indicates one trial with a particular set of text query formulations.
