
Fig. 2: Weather forecasting accuracy scores for deterministic and stochastic models.
From: Neural general circulation models for weather and climate
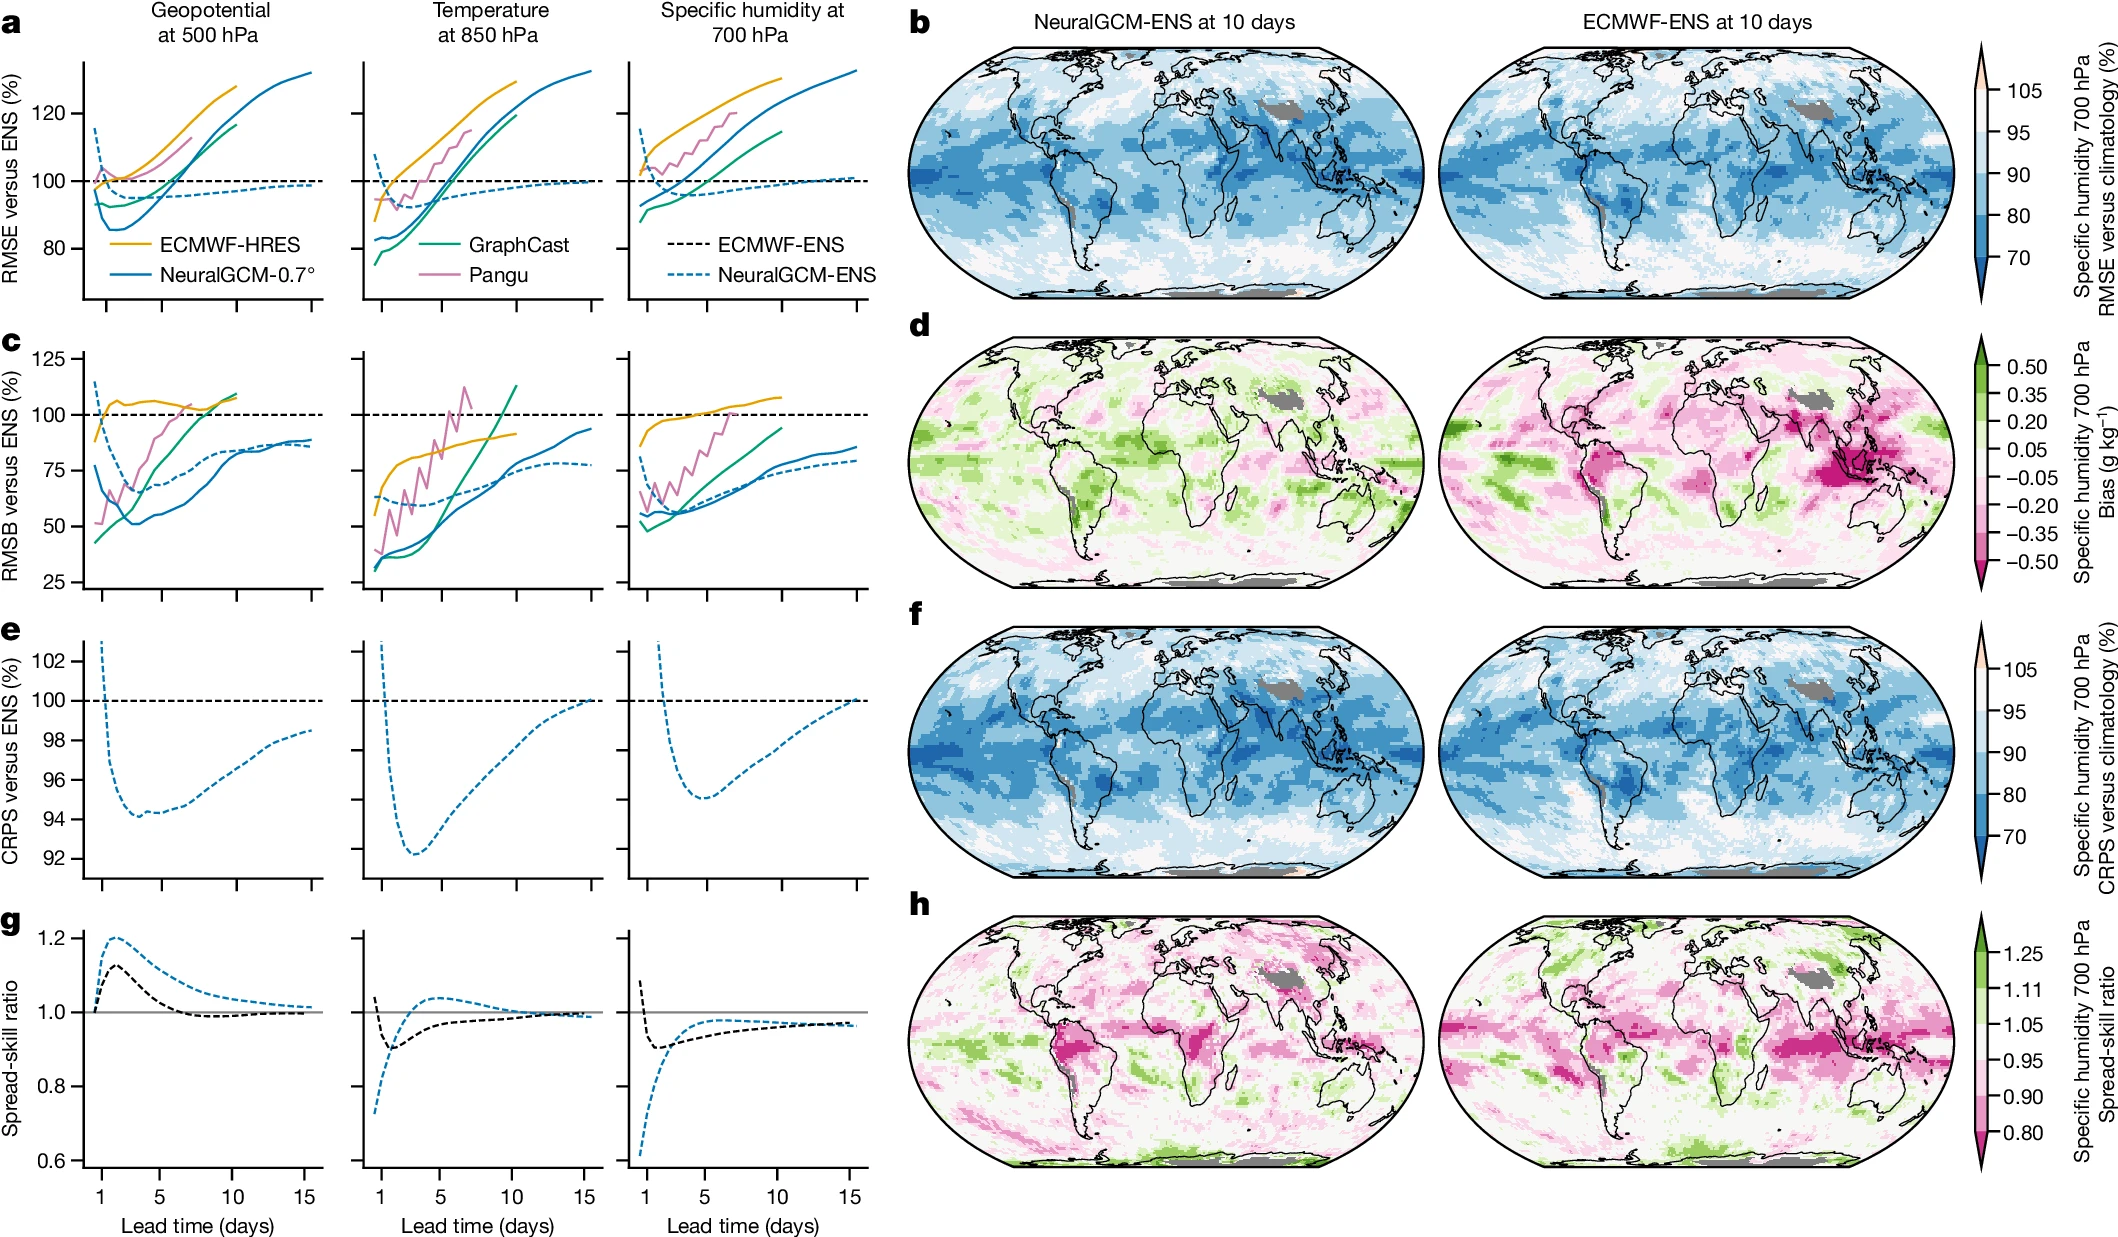
a,c, RMSE (a) and RMSB (c) for ECMWF-ENS, ECMWF-HRES, NeuralGCM-0.7°, NeuralGCM-ENS, GraphCast3 and Pangu4 on headline WeatherBench2 variables, as a percentage of the error of ECMWF-ENS. Deterministic and stochastic models are shown in solid and dashed lines respectively. e,g, CRPS relative to ECMWF-ENS (e) and spread-skill ratio for the ENS and NeuralGCM-ENS models (g). b,d,f,h, Spatial distributions of RMSE (b), bias (d), CRPS (f) and spread-skill ratio (h) for NeuralGCM-ENS and ECMWF-ENS models for 10-day forecasts of specific humidity at 700 hPa. Spatial plots of RMSE and CRPS show skill relative to a probabilistic climatology12 with an ensemble member for each of the years 1990–2019. The grey areas indicate regions where climatological surface pressure on average is below 700 hPa.
