
Fig. 1: Record-shattering jumps in global SSTs as observed in 2023–2024 also occur in climate model simulations.
From: Record sea surface temperature jump in 2023–2024 unlikely but not unexpected
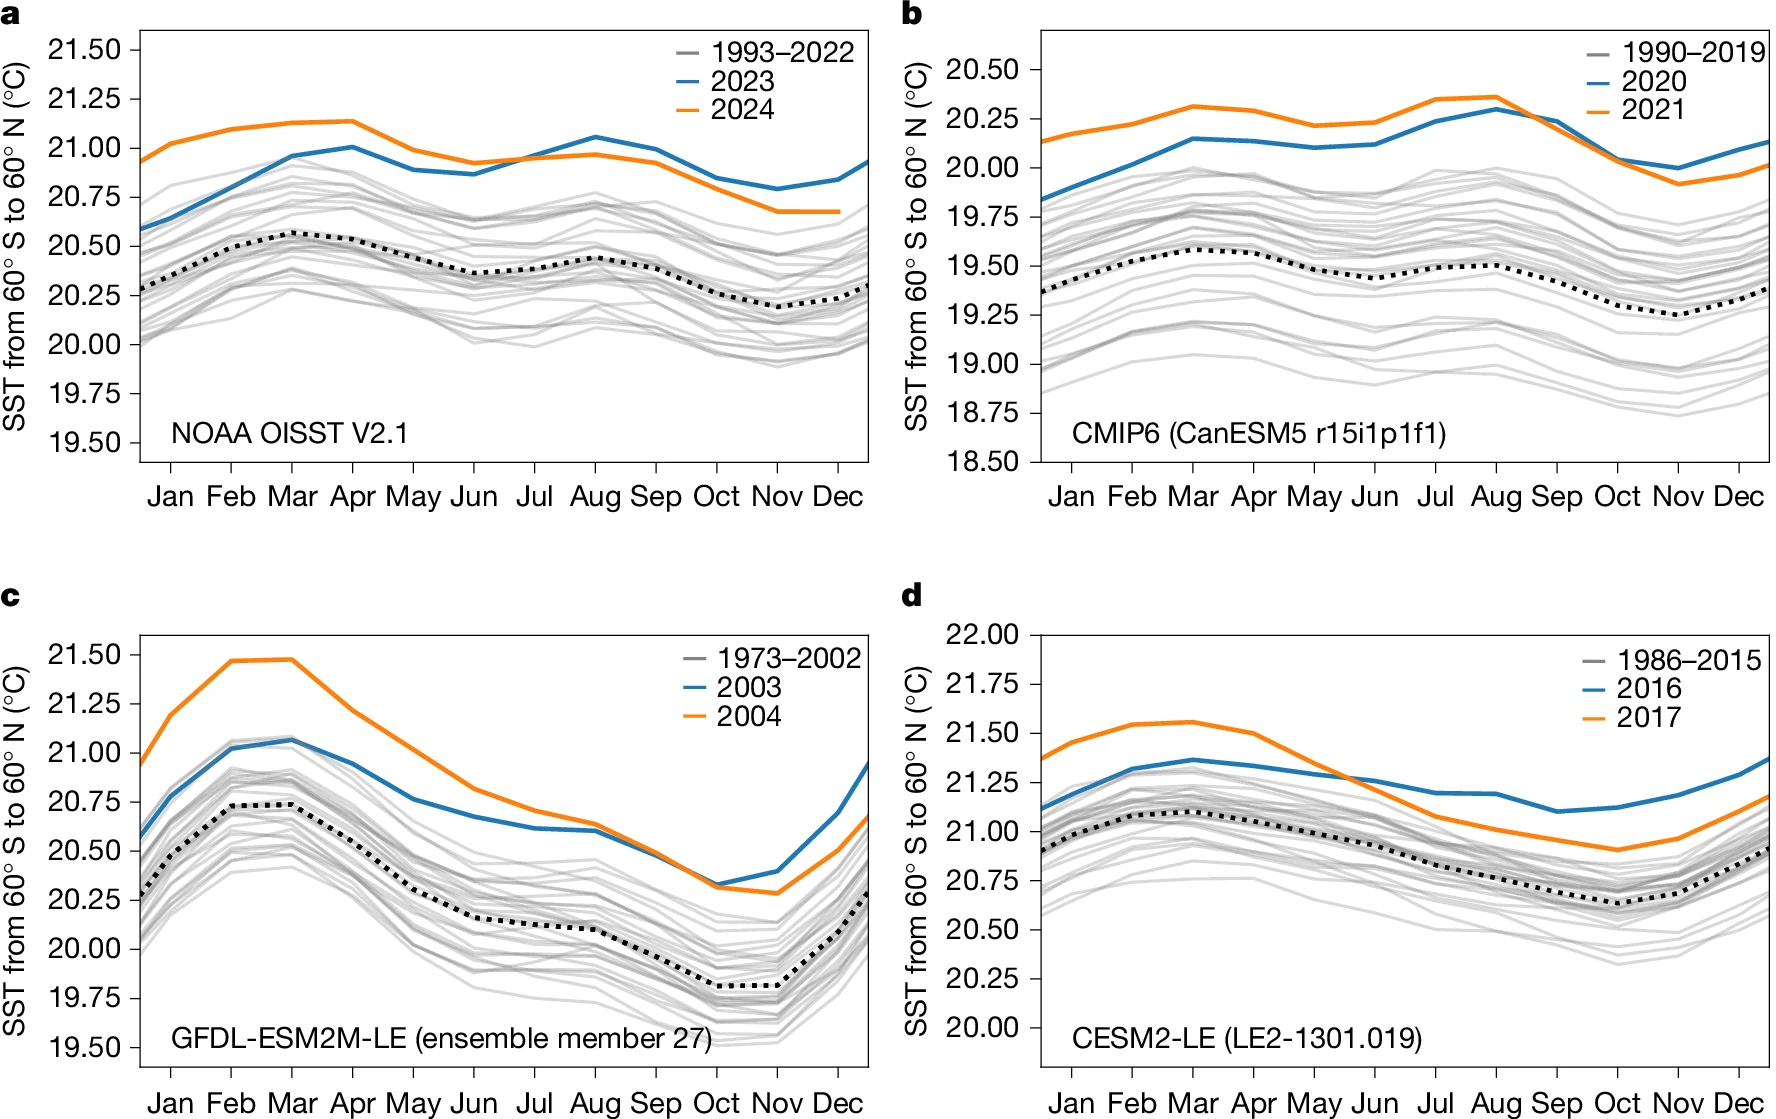
a–d, Monthly mean SST anomalies for the largest record-shattering annual (April to March) global (60° S–60° N) SST events before 2024 for observations from NOAA OISST V2.11 (a), and climate model simulations from one CMIP6 simulation (CanESM539,40 r15i1p1f1; b), from one simulation of the GFDL-ESM2M41 large ensemble (LE)42 (ensemble member 27; c) and from one simulation of the CESM243 large ensemble44 (ensemble member LE2-1301.019; d). The years of the onset of the respective events are shown as blue lines, the years of the subsequent decline are shown as orange lines, and the 30 preceding years are shown as grey lines with their mean as a black dotted line. For each of the three climate model groups (Coupled Model Intercomparison Project Phase 6 (CMIP6), GFDL-ESM2M-LE and CESM2-LE), the largest record-breaking global jump in SSTs before 2023 is shown. Monthly SST anomalies for all simulated record-shattering global jumps in SSTs between 2000 and 2040 that are larger in magnitude than the observed global jump in SSTs in 2023 and 2024 are shown in Extended Data Fig. 1.
