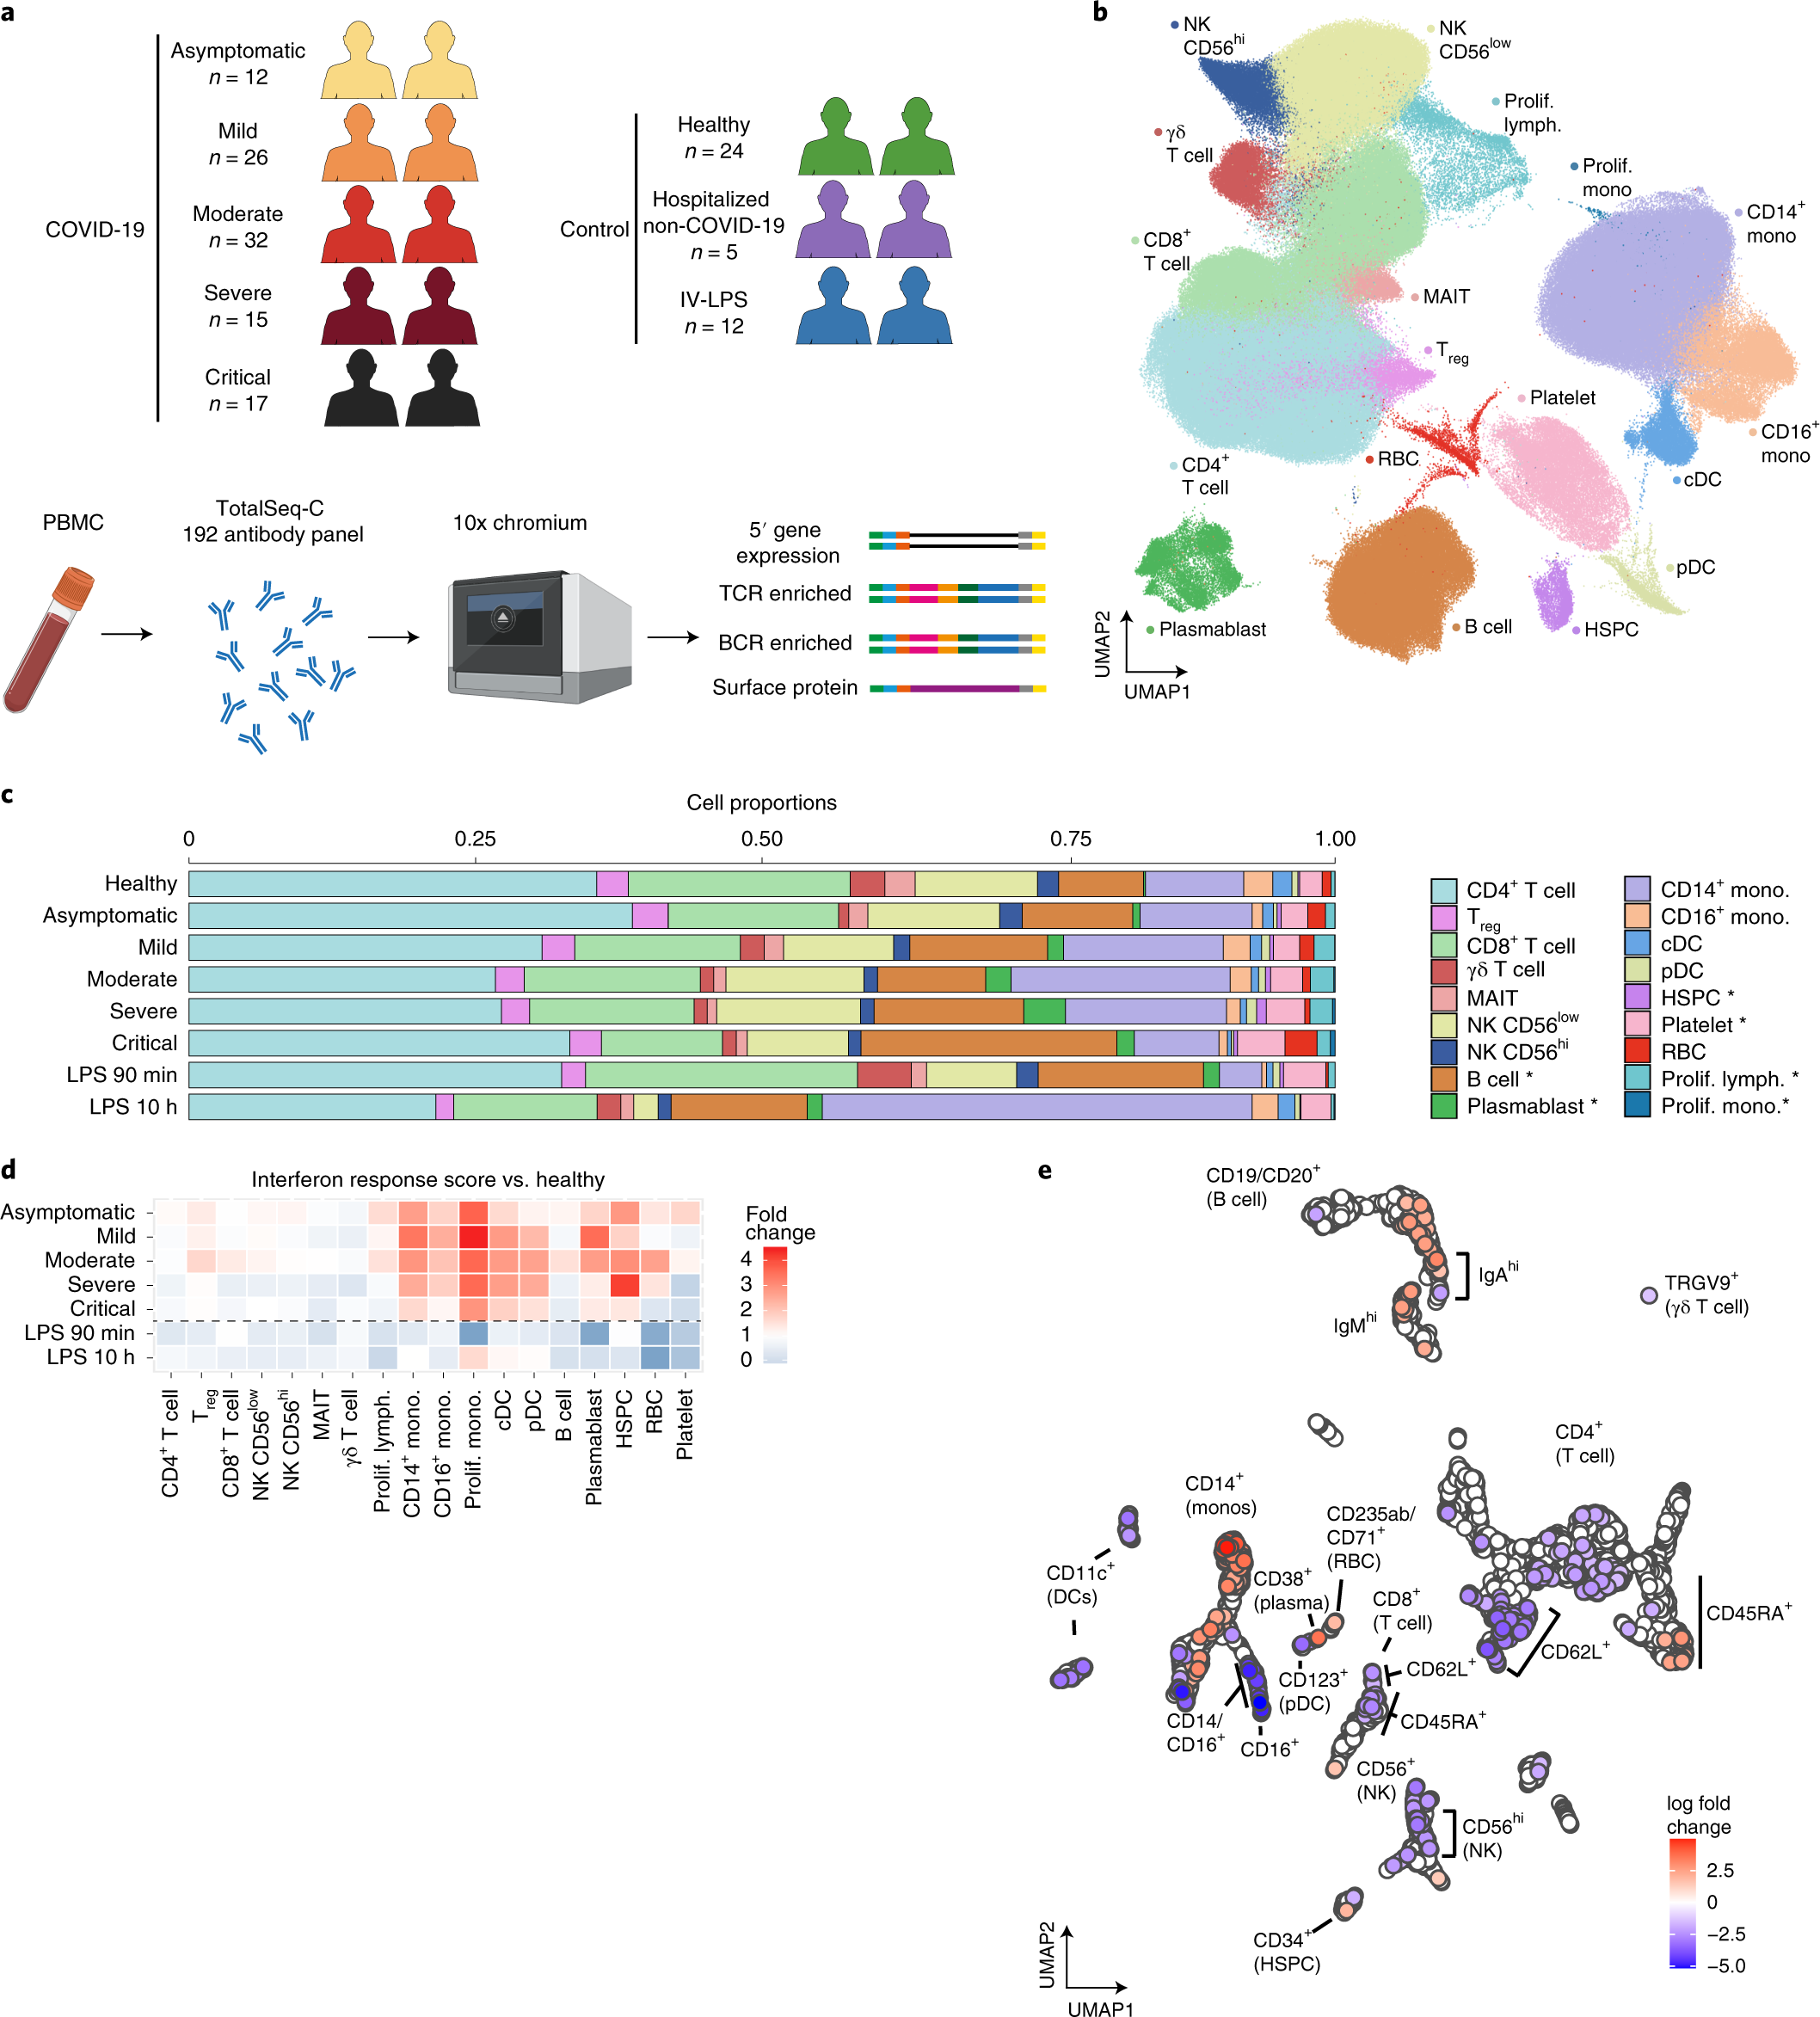
Fig. 1: Single-cell multi-omics analysis of PBMCs from individuals with COVID-19 and controls.
From: Single-cell multi-omics analysis of the immune response in COVID-19

a, Overview of the participants included and the samples and data collected. Figure was created using BioRender.com. b, UMAP visualization of all 781,123 cells after QC. Leiden clusters based on 5′ gene expression shown and colored by cell type. Lymph, lymphocyte; mono, monocyte; prolif, proliferating. c, Bar plot of the proportion of cell types shown in b, separated by condition and COVID-19 severity status. Hypothesis testing was performed using quasi-likelihood F-test comparing healthy controls to individuals with COVID-19 for linear trends across disease severity groups (healthy > asymptomatic > mild > moderate > severe > critical). Differentially abundant cell types were determined using a 10% FDR and are marked with an asterisk. d, Enrichment of interferon response of each cell state separated by severity. IFN response was calculated using a published gene list (GO:0034340) e, UMAP computed using batch-corrected mean staining intensities of 188 antibodies for 4,241 hyperspheres. Each hypersphere represents an area in the 188-dimensional space and is colored by significant (spatial FDR < 0.05) severity-associated changes in abundance of cells within that space.
