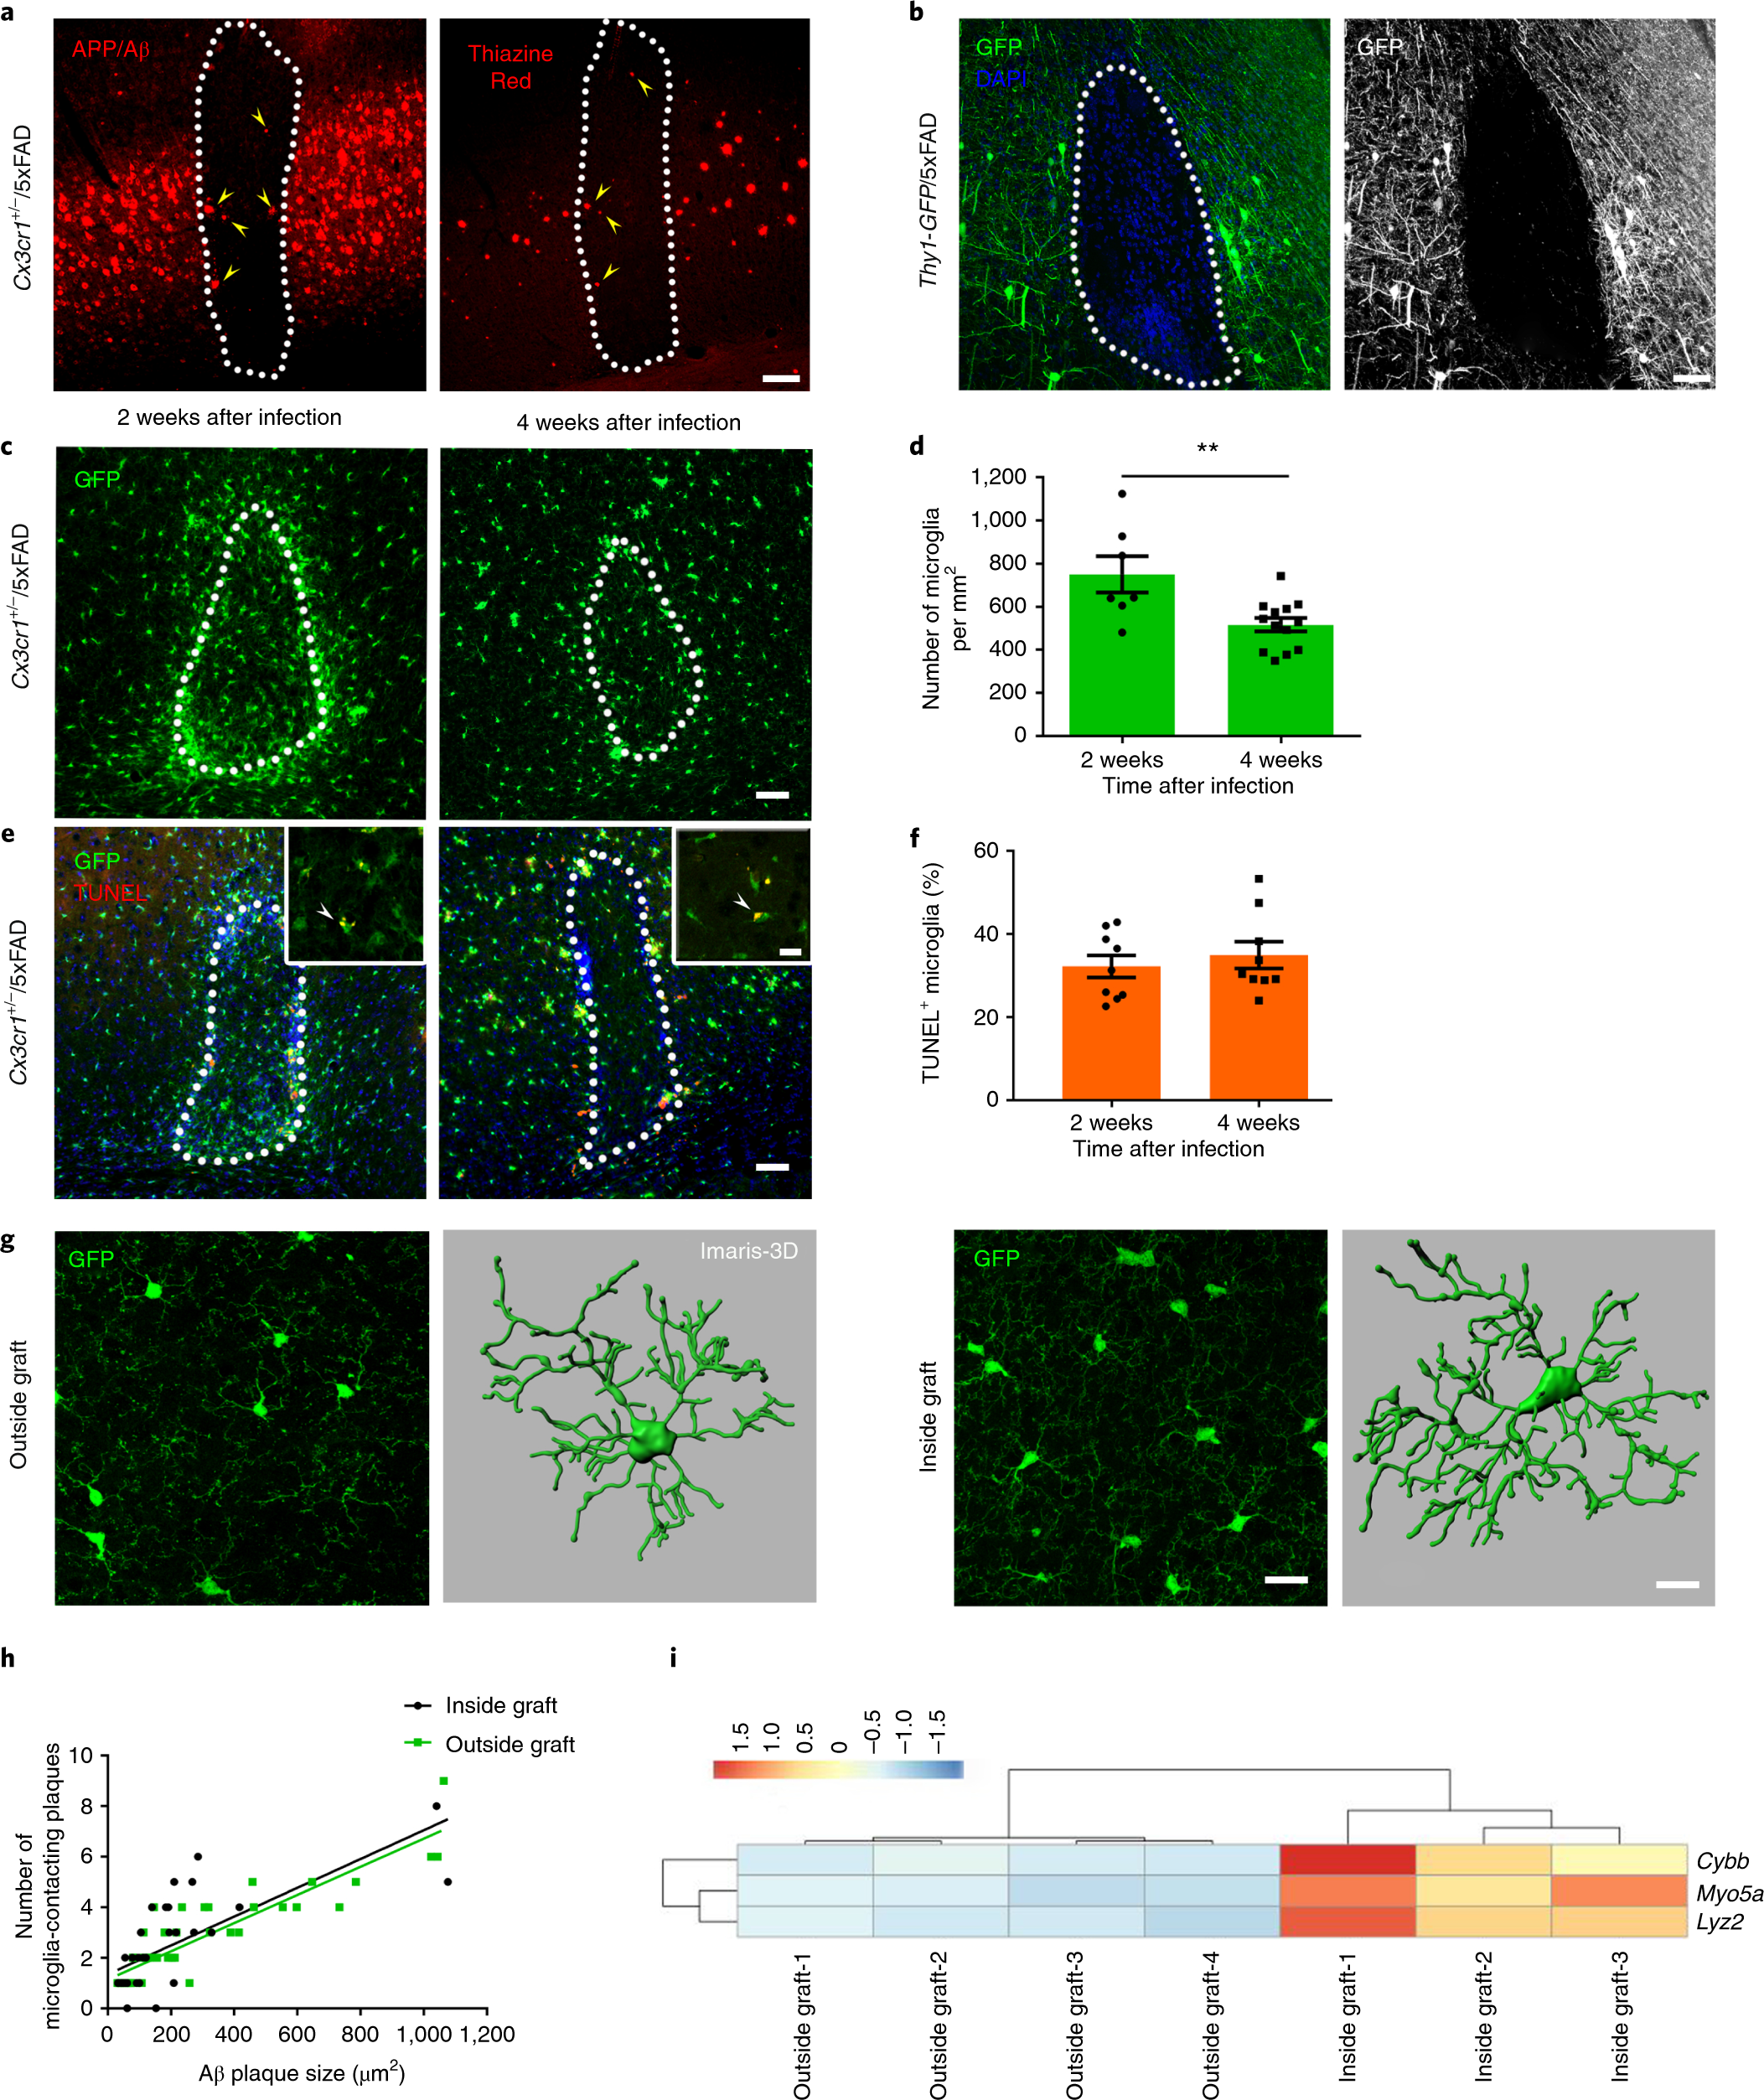
Fig. 1: Characteristics of microglia in neuronal WT grafts.
From: Microglia contribute to the propagation of Aβ into unaffected brain tissue

a, Fluorescence microscopy of a graft 4 weeks after injection into Cx3cr1+/−/5xFAD cortex. Yellow arrowheads indicate Aβ deposition (left: 6E10 in red, from n = 9 mice; right: Thiazine Red in red, from n = 4 mice) inside the graft (outlined with a white dotted line). Scale bar, 50 μm. b, Representative fluorescence microscopy of a graft at 4 weeks after injection in Thy1-GFP/5xFAD recipient mice, from n = 4 mice. Scale bar, 50 μm. c, Analysis of microglia accumulation inside grafts at 2 and 4 weeks after injection in Cx3cr1+/−/5xFAD transgenic mice. Scale bar, 50 μm. d, Graph shows mean (± s.e.m.) of microglia cell density inside grafts; each symbol represents one graft from n = 7 (2 weeks) and n = 13 (4 weeks) mice. Significant differences were determined using the Mann–Whitney test (**P = 0.0085). e, Fluorescence microscopy of TUNEL-positive (red) microglia (green) inside grafts at 2 and 4 weeks after injection in Cx3cr1+/−/5xFAD transgenic mice. Scale bars, 50 μm in the overview and 15 μm in the inset. f, Percentage of TUNEL-positive microglia inside grafts. Each symbol represents one graft from n = 9 mice per group. Data are presented as mean (± s.e.m.). Significant differences were determined using the two-tailed Mann–Whitney test. g, Confocal microscopy and Imaris-3D reconstruction of microglia outside (left) or inside (right) the graft. Scale bars, 20 μm in the confocal acquisition and 10 μm in the Imaris reconstruction. For 3D reconstruction, we considered two regions inside and outside grafts in n = 2 mice per group. h, Pearson correlation between the number of microglia-contacting plaques and plaque size inside (r = 0.53, P < 0.0001) and outside (r = 0.80, P < 0.0001) the grafts. Each symbol represents one compact plaque from n = 7 Cx3cr1+/−/5xFAD mice. i, Heat map of the three top differentially regulated genes (**P < 0.01) in microglia FACS-sorted from either isolated cortical grafts or cortical regions outside the transplant that were used as controls. Differentially expressed genes were determined using the limma-voom package in R.
