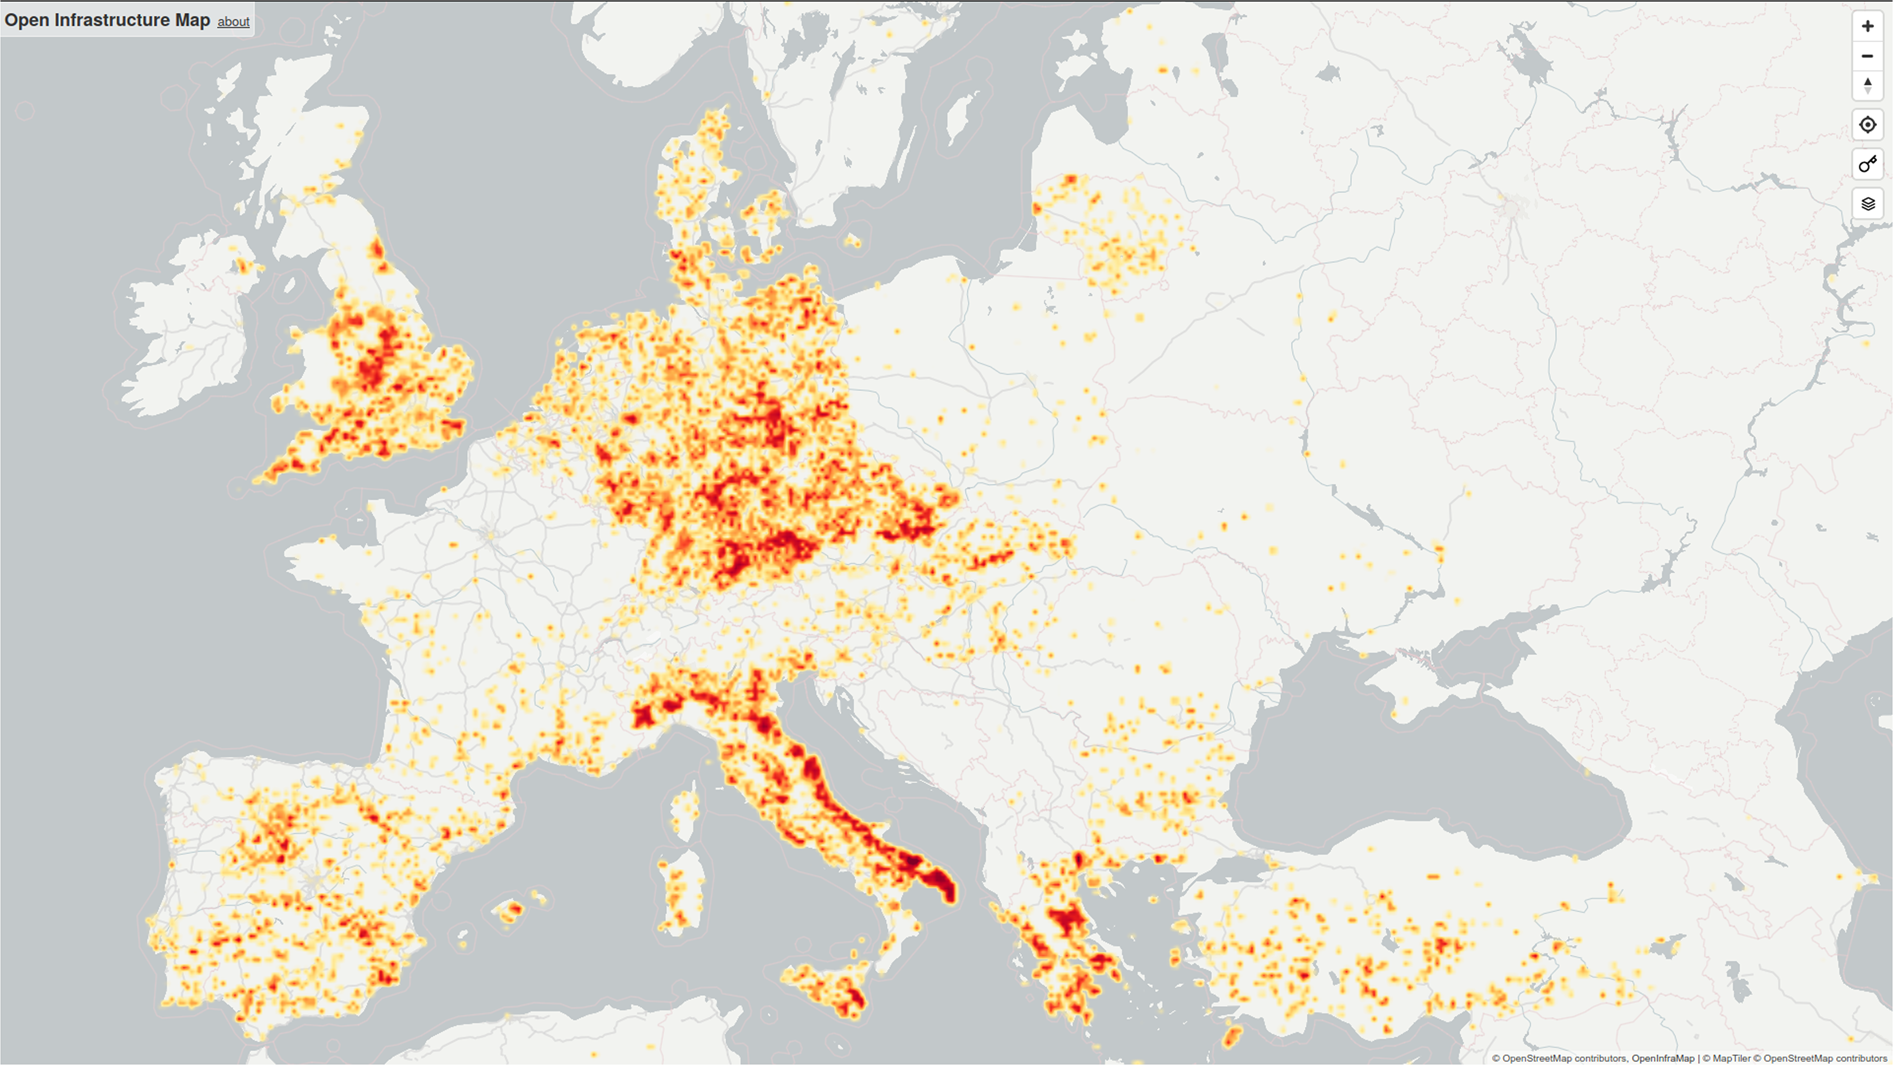
Fig. 1
From: A harmonised, high-coverage, open dataset of solar photovoltaic installations in the UK

Solar PV explicitly tagged in OpenStreetMap, as of May 2020, shown as a heatmap of power capacity subtotals. Note the substantial variation between countries, often due to specific mapping initiatives in country communities: for example the relatively low density in France is unreflective of that country’s installed capacity. Image credit: Russ Garrett, openinframap.org.
