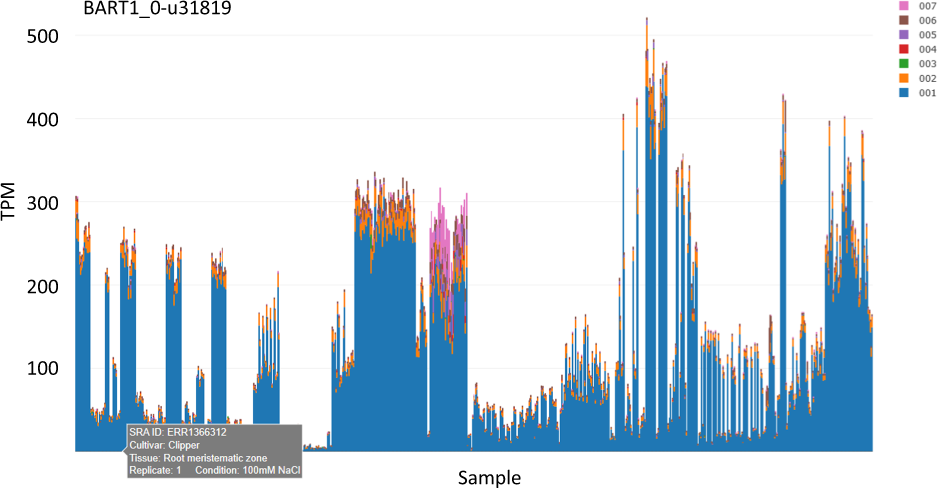
Fig. 1
From: EORNA, a barley gene and transcript abundance database

Variable expression between RNA-seq samples. The plot represents transcript abundances as transcripts per million (TPM) across 843 samples for BaRT1_0-u31919 (similarity to a small nuclear ribonucleoprotein family protein). Different colours represent different transcripts for that gene. Scanning over the plot gives a label describing cultivar, tissue, experimental condition (if available), replicate number and the short-read archive sequencing read number.
