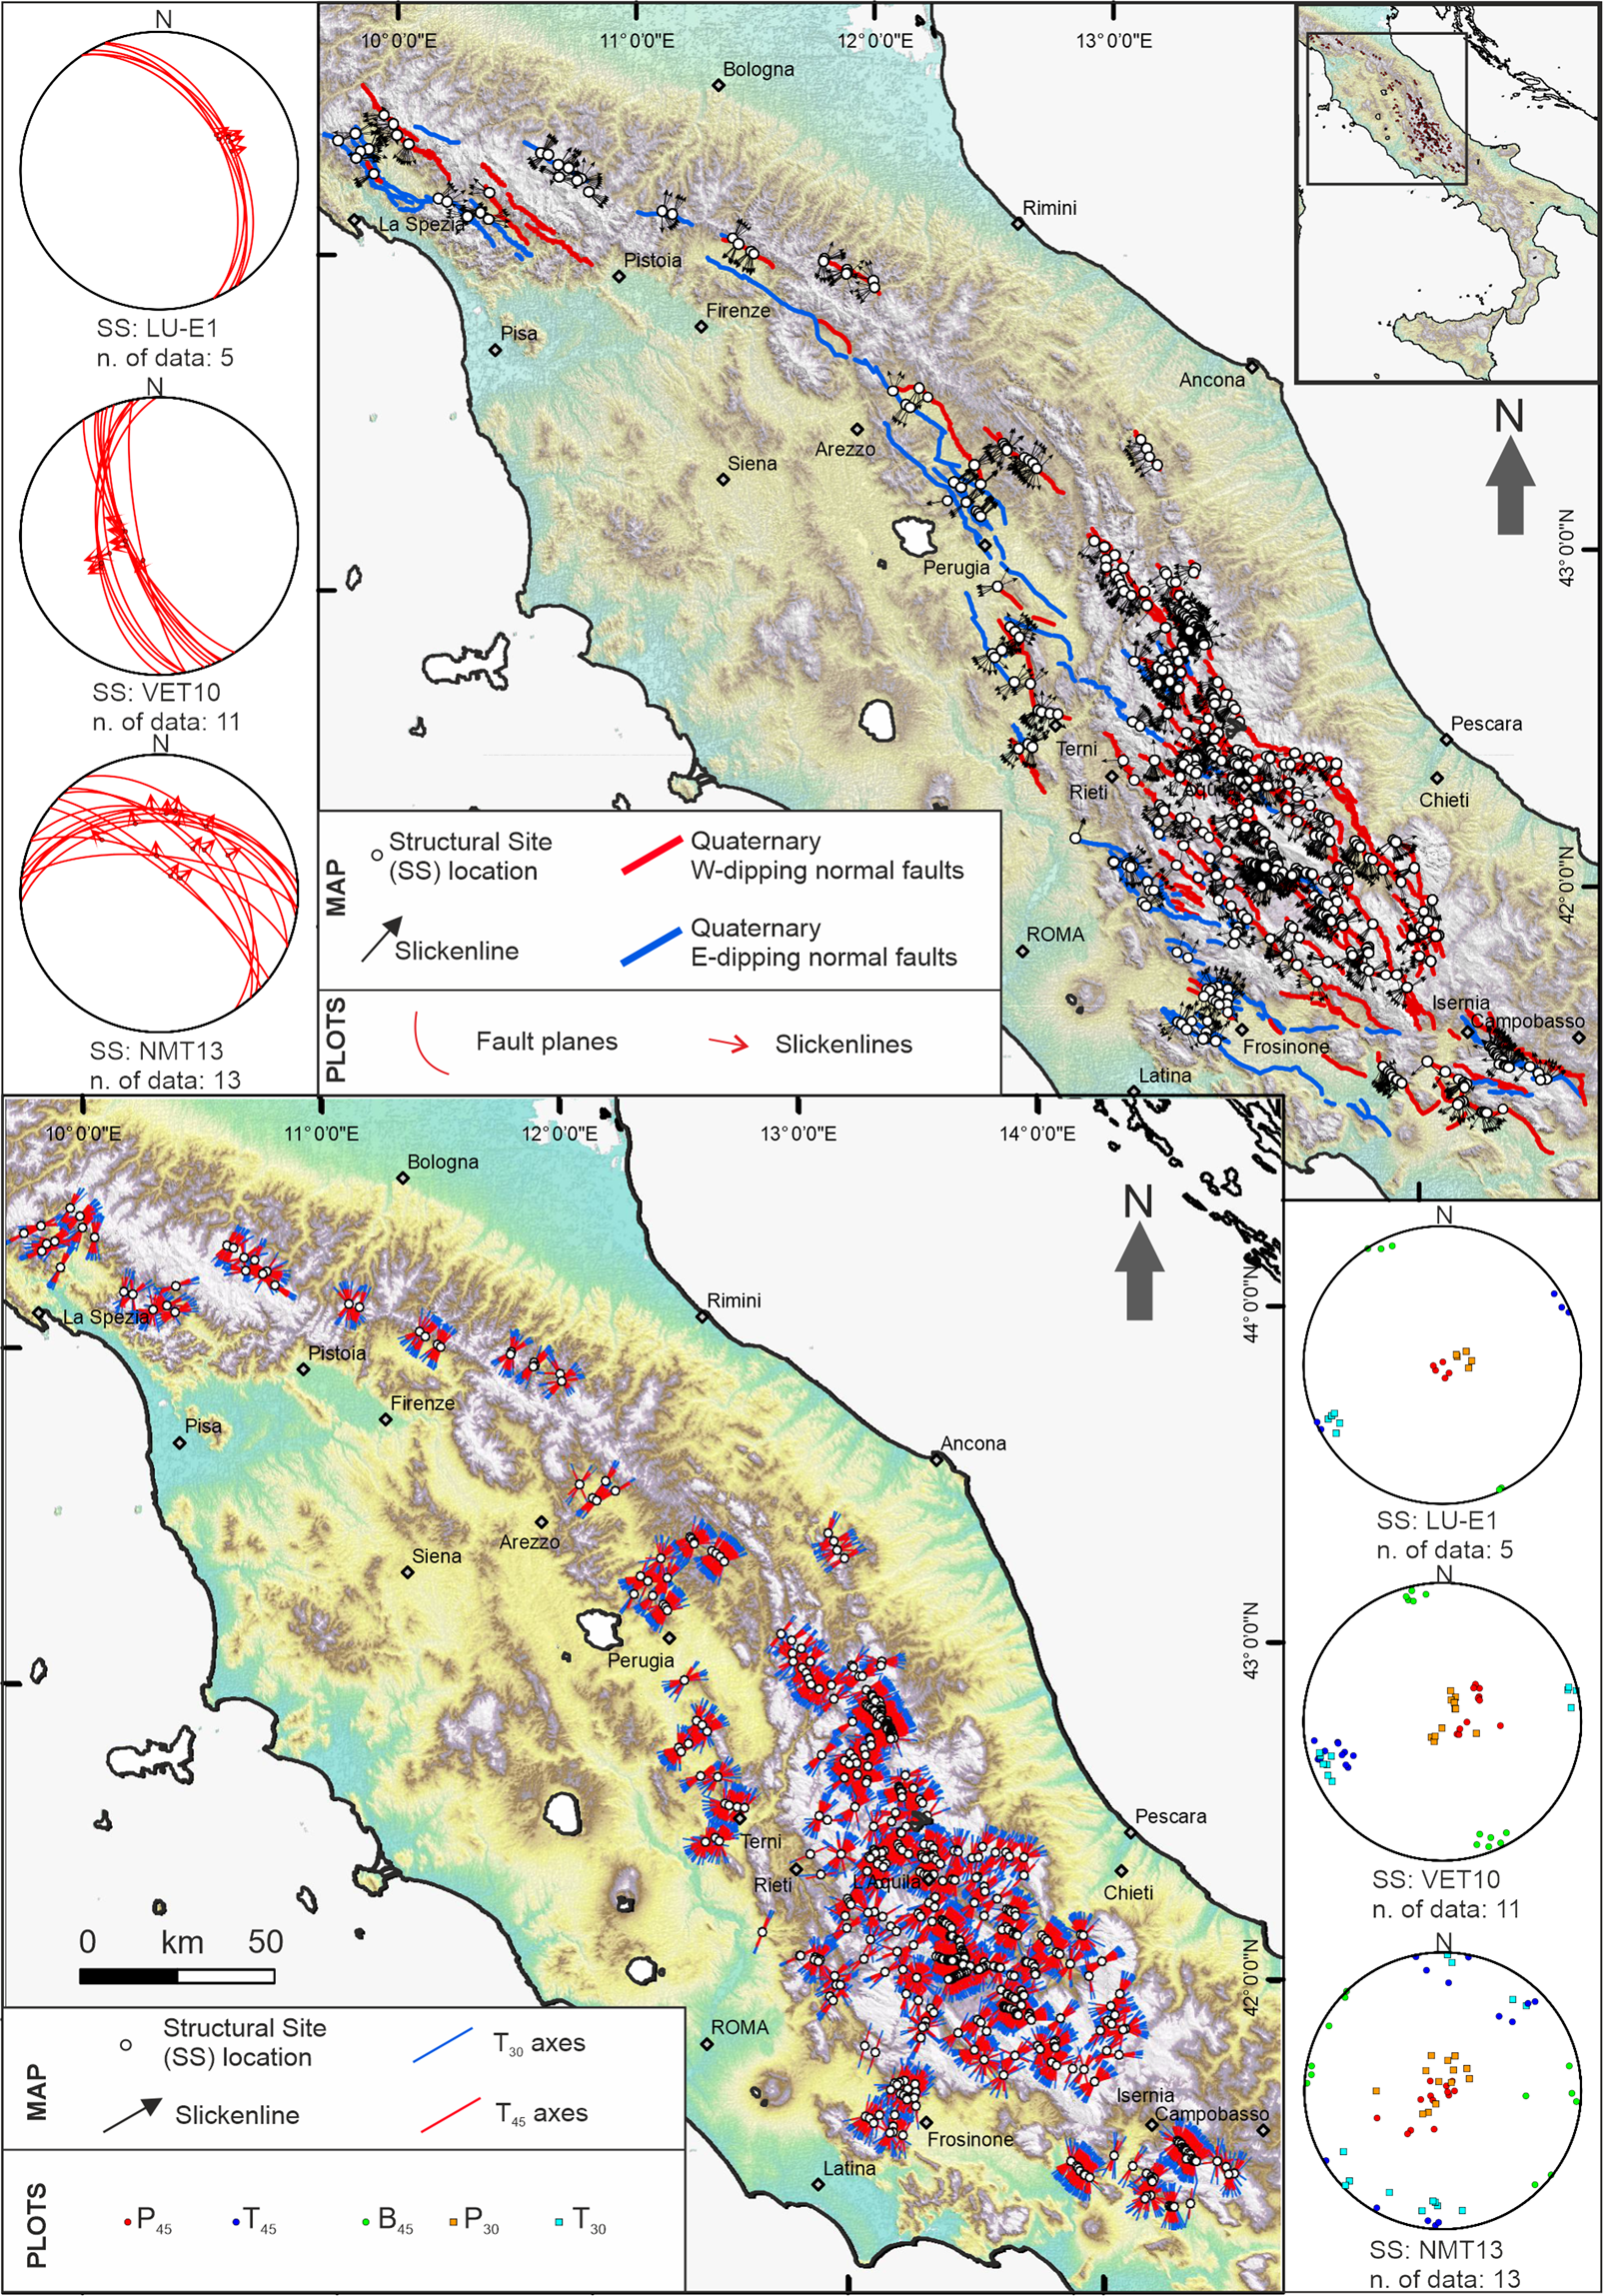
Fig. 1

Map view of the Host Faults and the QUIN database. (a) Structural Sites (SS) and slip vectors from the Fault/Striation Pairs (FSPs) data in the QUIN database; the SS are projected on a shaded relief map of northern-central Apennines of Italy along the trace of Quaternary normal faults hosting the SS; fault traces are derived from the Host Fault database (see next section). Stereoplots (Lambert equal-area, lower hemisphere projection) at the map side represent examples of FSP data for three SS chosen across the Quaternary fault belt; key: LU-E1, VET10, NMT13 = SS short names as reported in the QUIN database. (b) T30- and T45-axis computed in this database, on a shaded relief map of northern-central Apennines of Italy. Stereoplots on the right of the figure represent the same SS as in panel a (same location), with the axes of the deformation obtained with the methodology described in the main text. Key: P45 and P30 = contractional axes, B45 = neutral axes; T45 and T30 = extensional axes.
