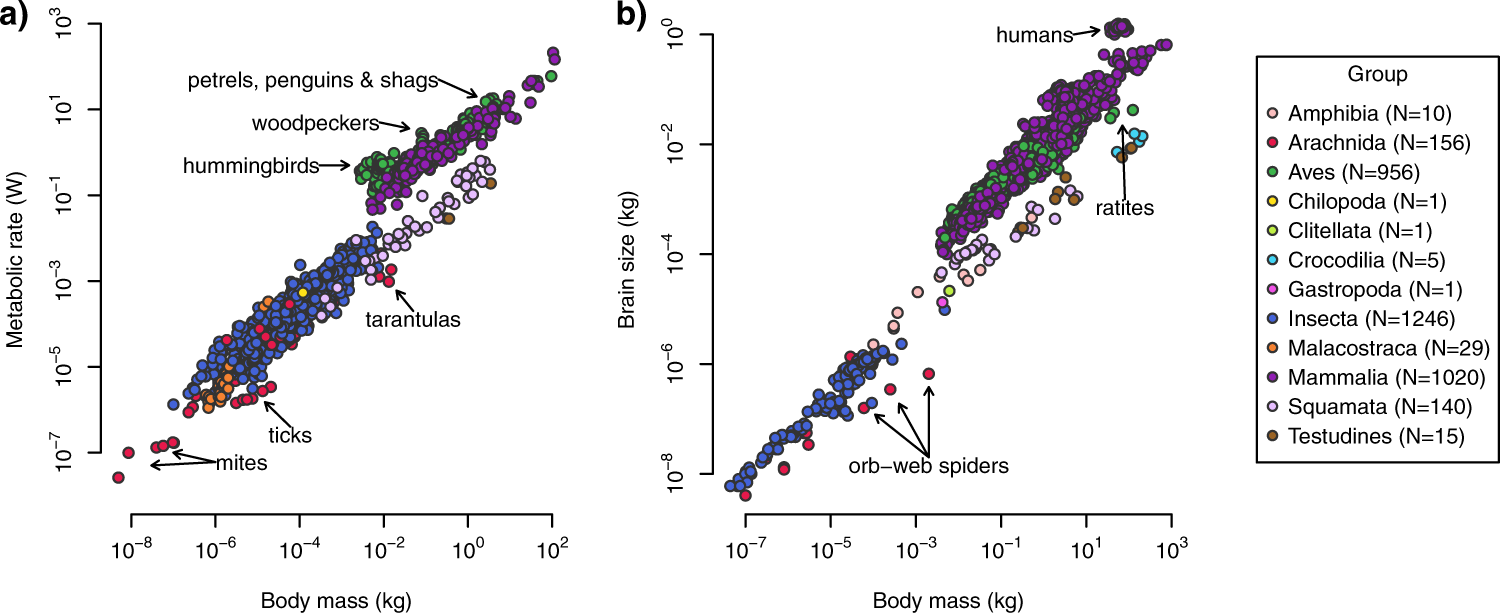
Fig. 1
From: AnimalTraits - a curated animal trait database for body mass, metabolic rate and brain size

Overview of the ranges of trait values in the database at time of publication. Each point represents a single observation of (a) body mass and metabolic rate, and (b) body mass and brain size. To orient the reader, some taxa with outstanding trait values are labelled in the graph. The differing allometries of endotherms and ectotherms are apparent for both metabolic rate and brain size. Axes are log-scaled.
