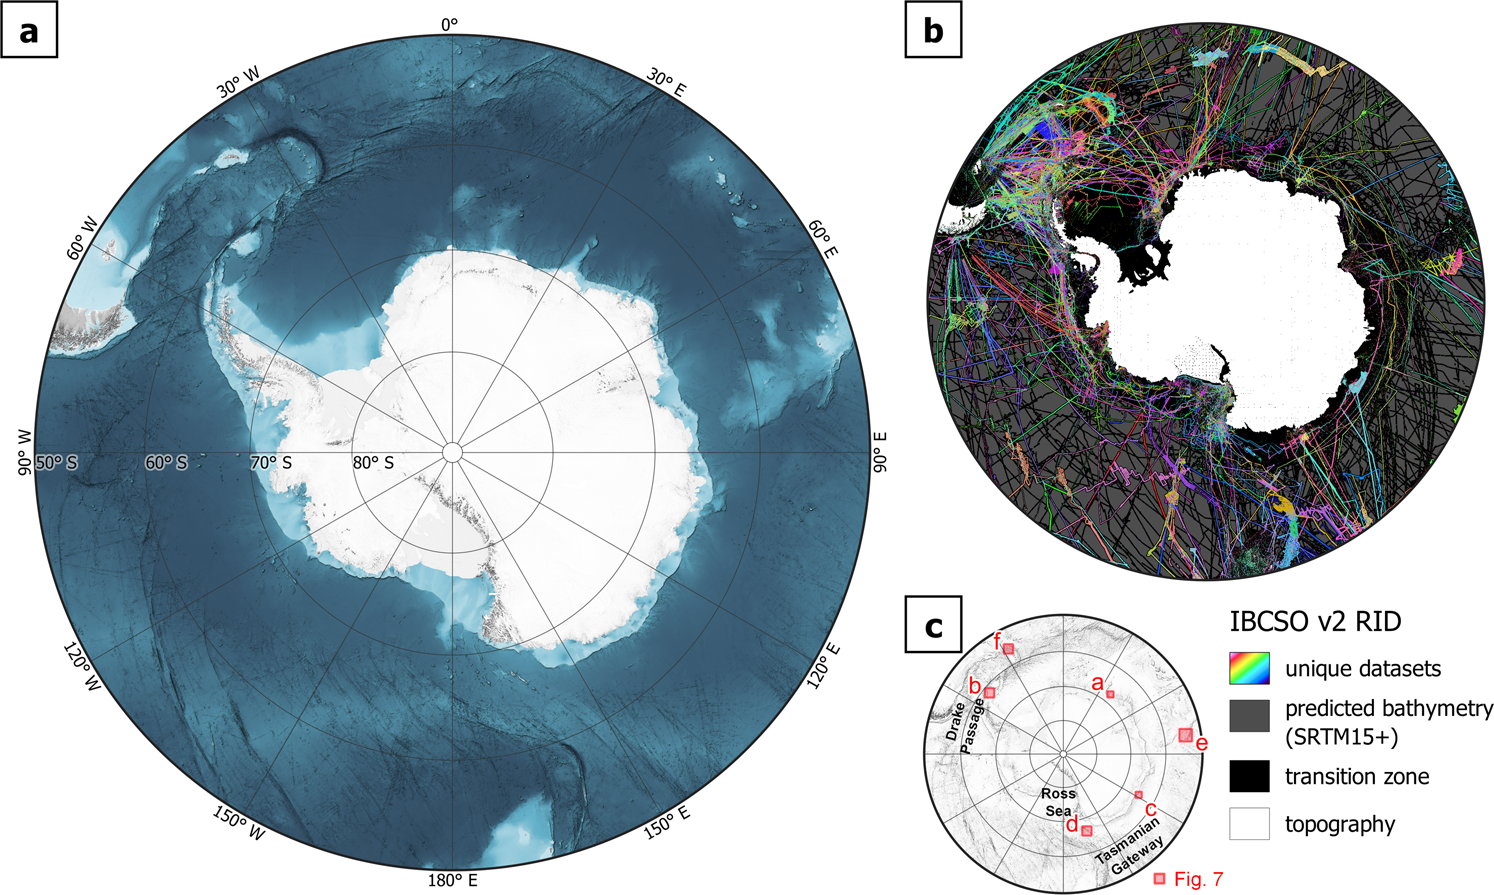
Fig. 1
From: The International Bathymetric Chart of the Southern Ocean Version 2

(a) Shaded relief of IBCSO v2 with ice surface topography. (b) Regional Identifier (RID) grid showing unique datasets (multicolours), topographic data (white), interpolated transition zone (black) and predicted bathymetry (dark grey). (c) Locations of example areas shown in Fig. 7.
