Figure 1

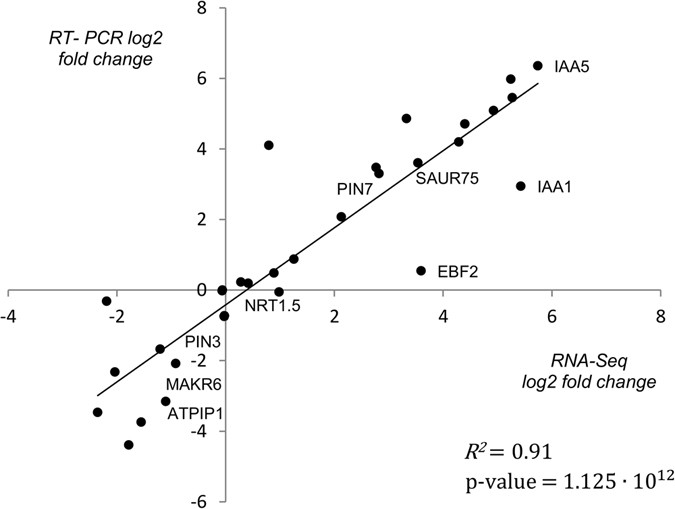
Scatterplot for log2 fold changes of 30 genes in RNA-Seq and qPCR experiments. Both log2 fold changes were well correlated (R 2 = 0.91, p < 5.0E-12, Supplementary Table 2).

Scatterplot for log2 fold changes of 30 genes in RNA-Seq and qPCR experiments. Both log2 fold changes were well correlated (R 2 = 0.91, p < 5.0E-12, Supplementary Table 2).