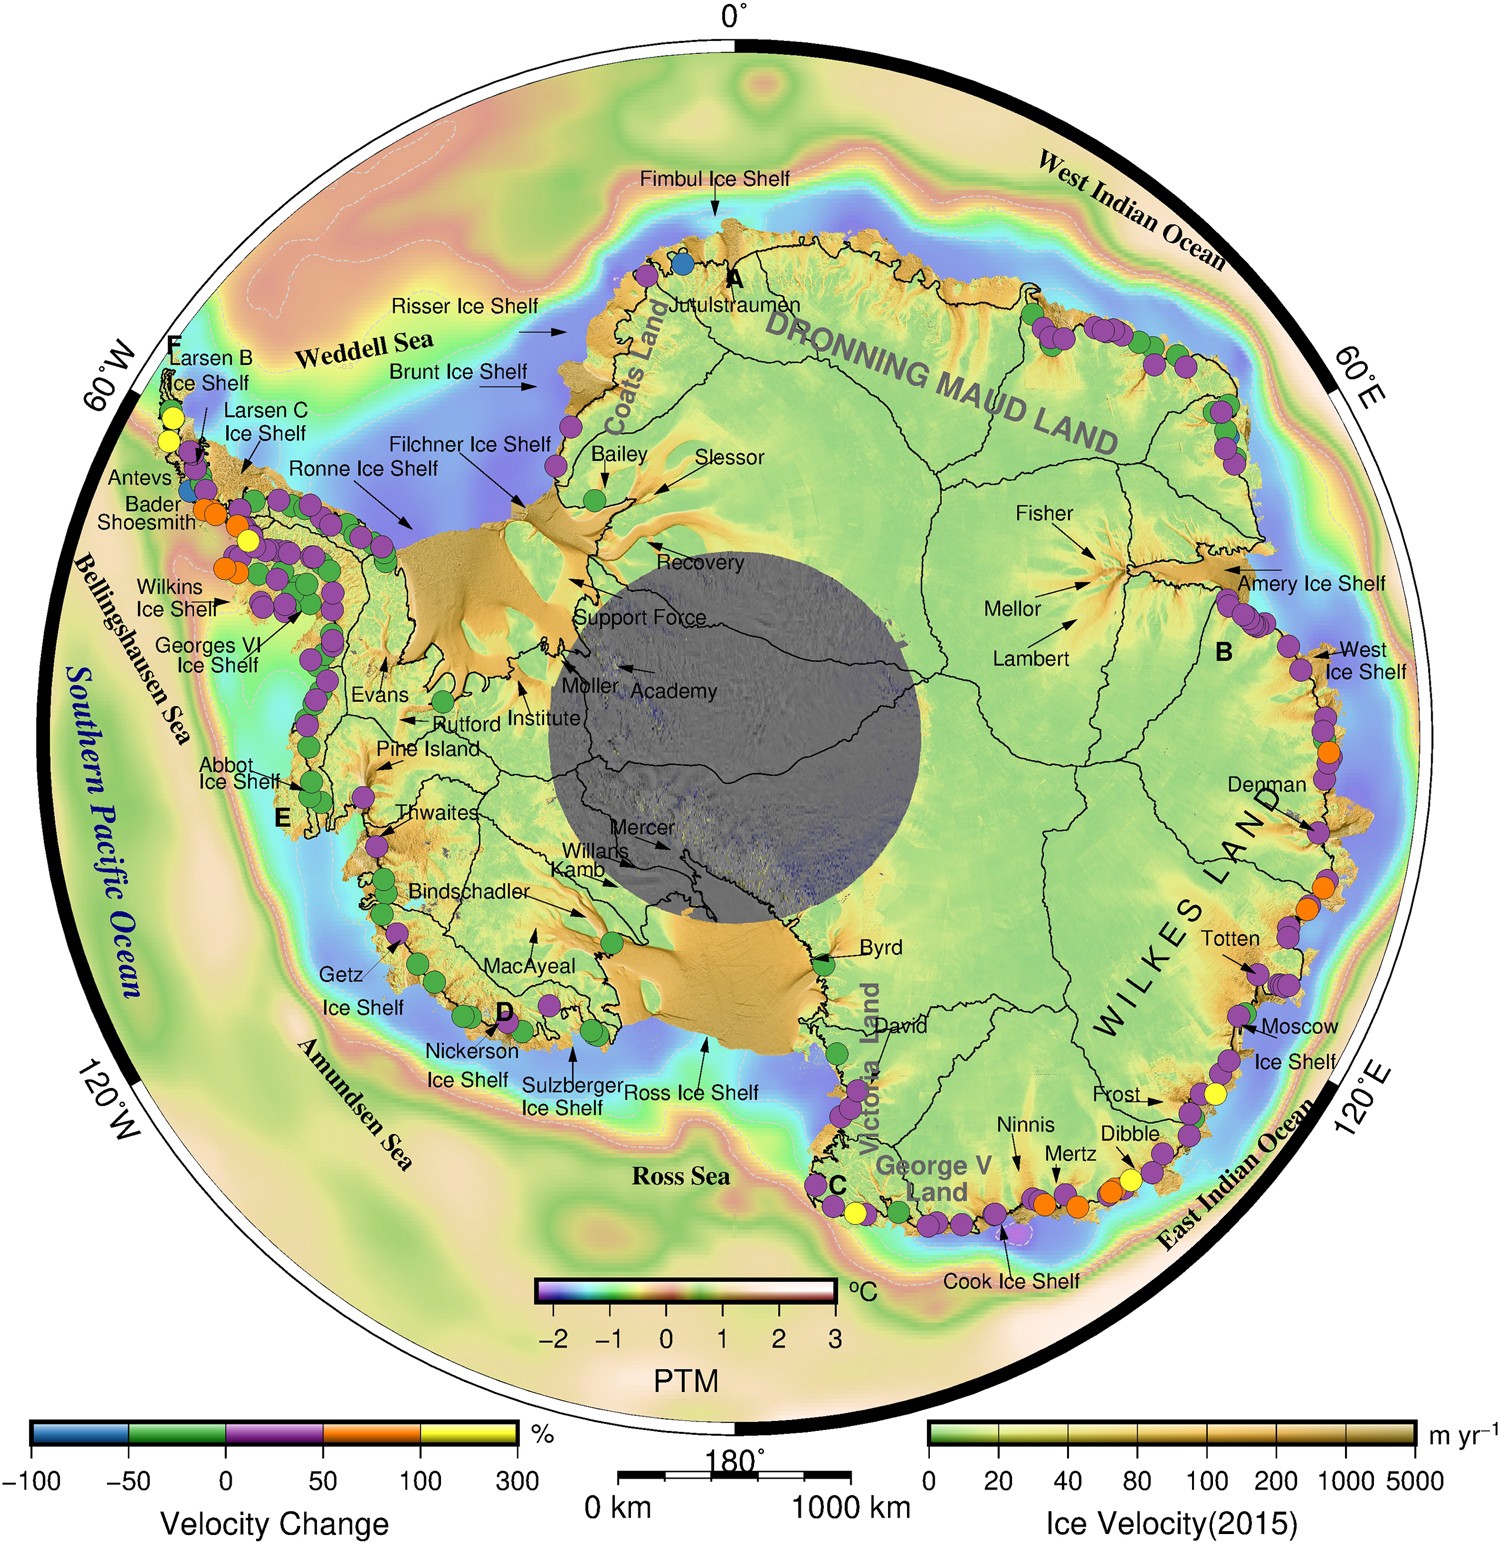
Figure 1

Antarctic ice velocity in 2015 and the velocity change between 2008 and 2015. The mosaic of the Antarctic ice velocity (2015) from L8 panchromatic images from January 2015 to March 2016 is shown here overlaid on a MODIS mosaic of Antarctica (MOA)34,35. The magnitude of the ice velocity is coloured on a logarithmic scale and overlaid on gridded potential seawater temperature data (PTM) at a depth of 200 m from the World Ocean Circulation Experiment (WOCE). The velocity changes at grounding lines are calculated for 466 glaciers between 2015 and 2008 and are shown for 211 glaciers with high confidence levels (>2 \(\sigma \)), which are coloured on a logarithmic scale. The names of selected glaciers and ice shelves are labelled. ‘A’ through ‘F’ delimits the six oceanic sectors. The details of ice velocity changes along grounding lines are presented in Table S1. The solid grey lines delineate major ice divides. This map was created using The Generic Mapping Tools version 5.2.1 (http://gmt.soest.hawaii.edu/)36.
