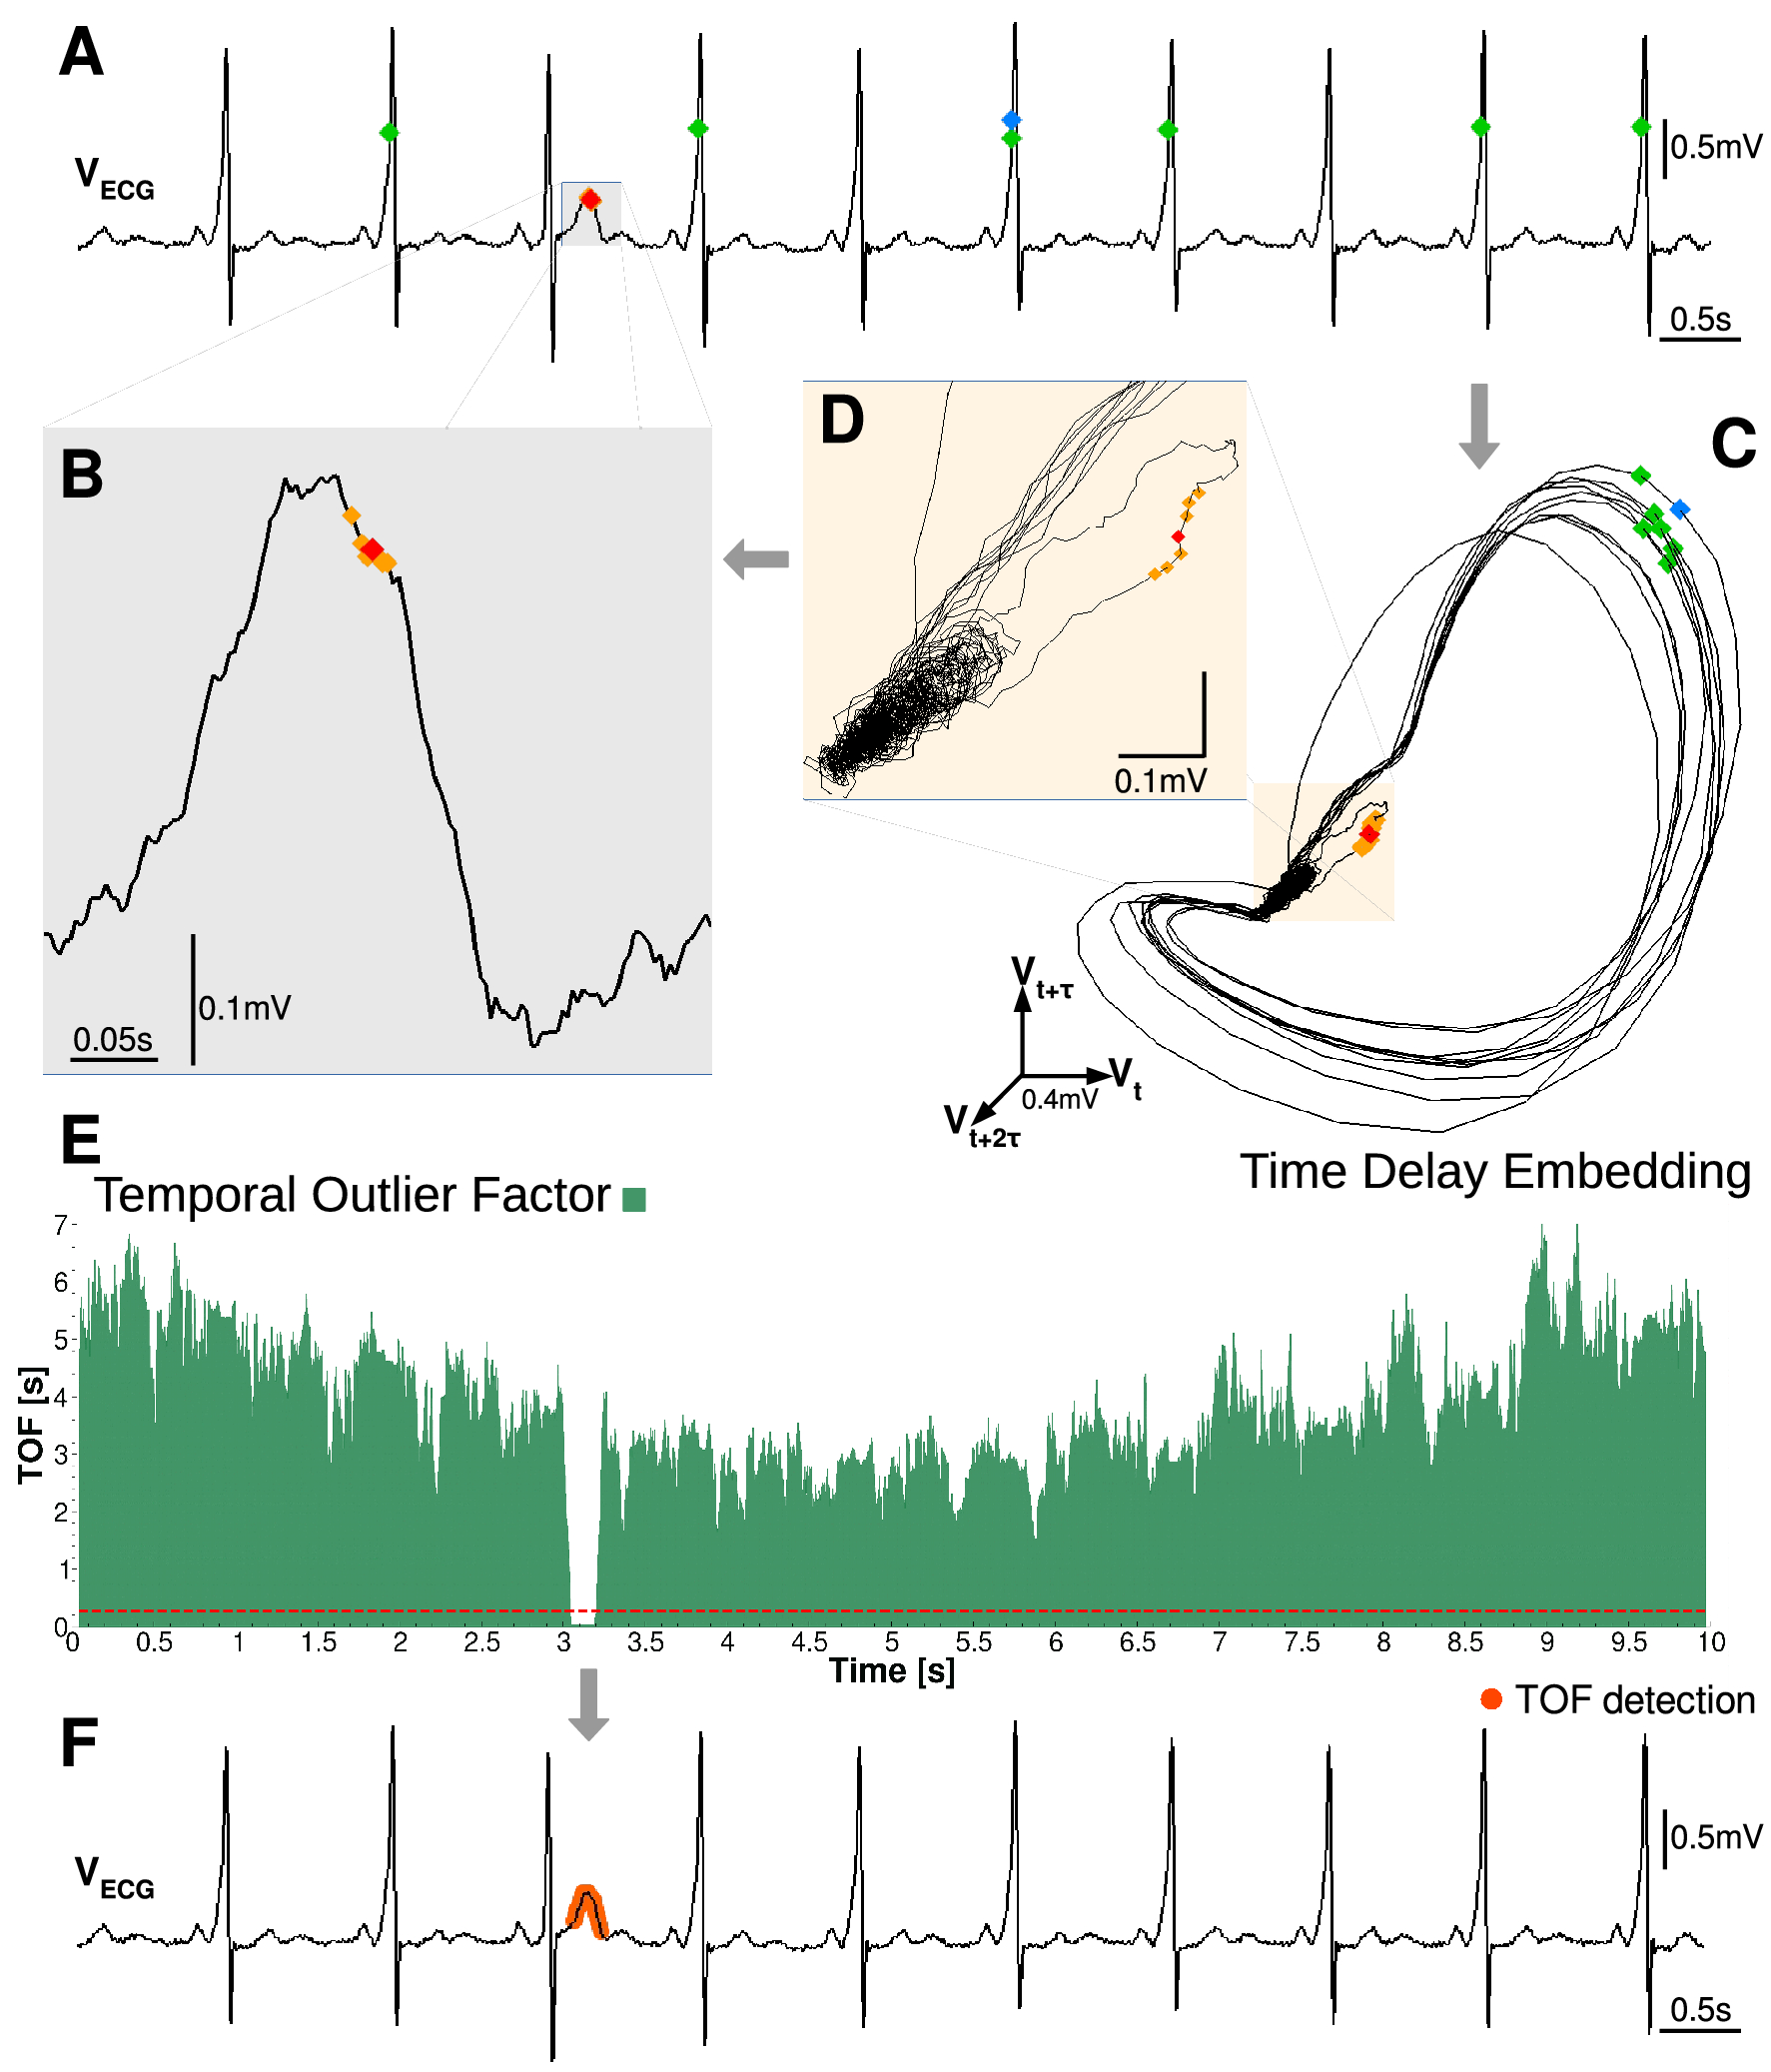
Figure 1

Schema of our unique event detection method and the Temporal Outlier Factor (TOF). (A) An ECG time series from a patient with Wolff-Parkinson-White Syndrome, a strange and unique T wave zoomed on graph (B). (C) The reconstructed attractor in the 3D state space by time delay embedding (\(E=3, \tau =0.011\,{\text{s}}\)). Two example states (red and blue diamonds) and their 6 nearest neighbors in the state space (orange and green diamonds respectively) are shown. The system returned several times back to the close vicinity of the blue state, thus the green diamonds are evenly distributed in time, on graph (A). In contrast, the orange state-space neighbors of the red point (zoomed on graph D) are close to the red point in time as well on graph (A). These low temporal distances show that the red point marks a unique event. (E) TOF measures the temporal dispersion of the k nearest state-space neighbors (\(k=20\)). The red dashed line is the threshold \(\theta =0.28\,{\text{s}}\). Low values of TOF below the threshold mark the unique events, denoted by orange dots on the original ECG data on graph (F).
