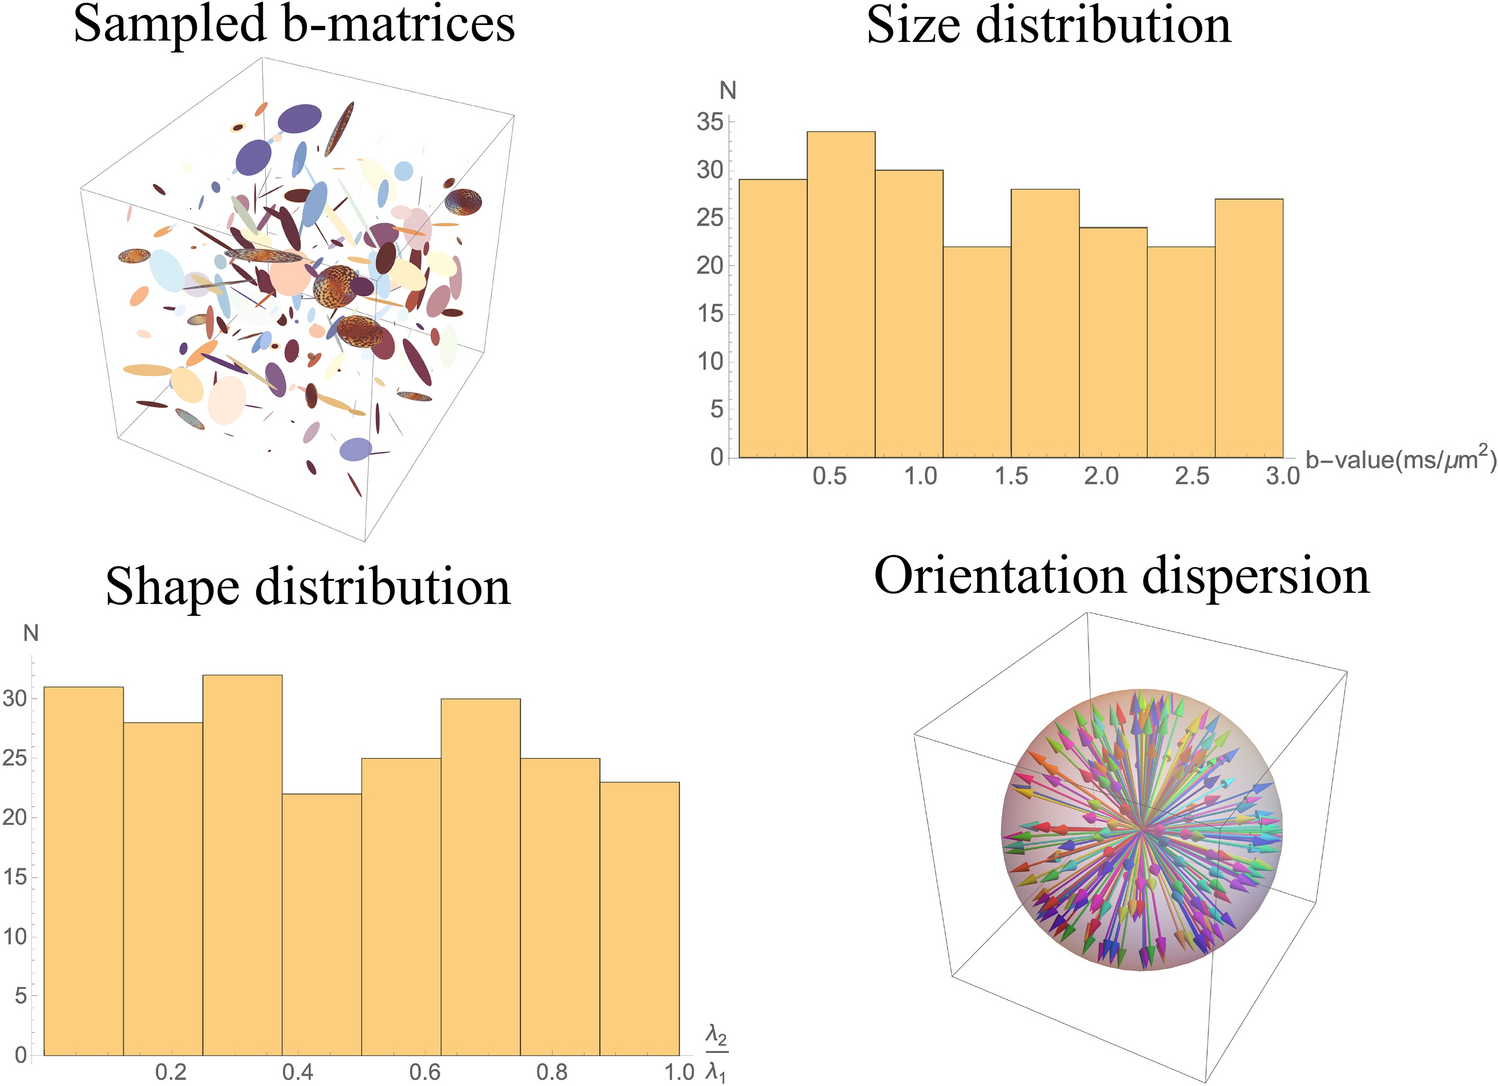
Figure 1

Experimental design for DTD estimation. (Top left) An example of the sampled rank-1 and rank-2 b-matrices (N = 216) shown as ellipses generated by randomly varying the sum and ratio of eigenvalues, and orientation of eigenvectors of the b-matrix. (Top right) Histogram of trace of b-matrix showing the uniform sampling in size. (Bottom left) Histogram of the ratio of two non-zero eigenvalues (\(\lambda _1 > \lambda _2\)) of the sampled b-matrices showing the uniform sampling in shape. (Bottom right) Orientation dispersion of the principal eigenvector of the sampled b-matrices showing the uniform sampling in orientation. The vectors are colored to distinguish the individual b-matrices. The above graphics was generated using the Mathematica software67.
