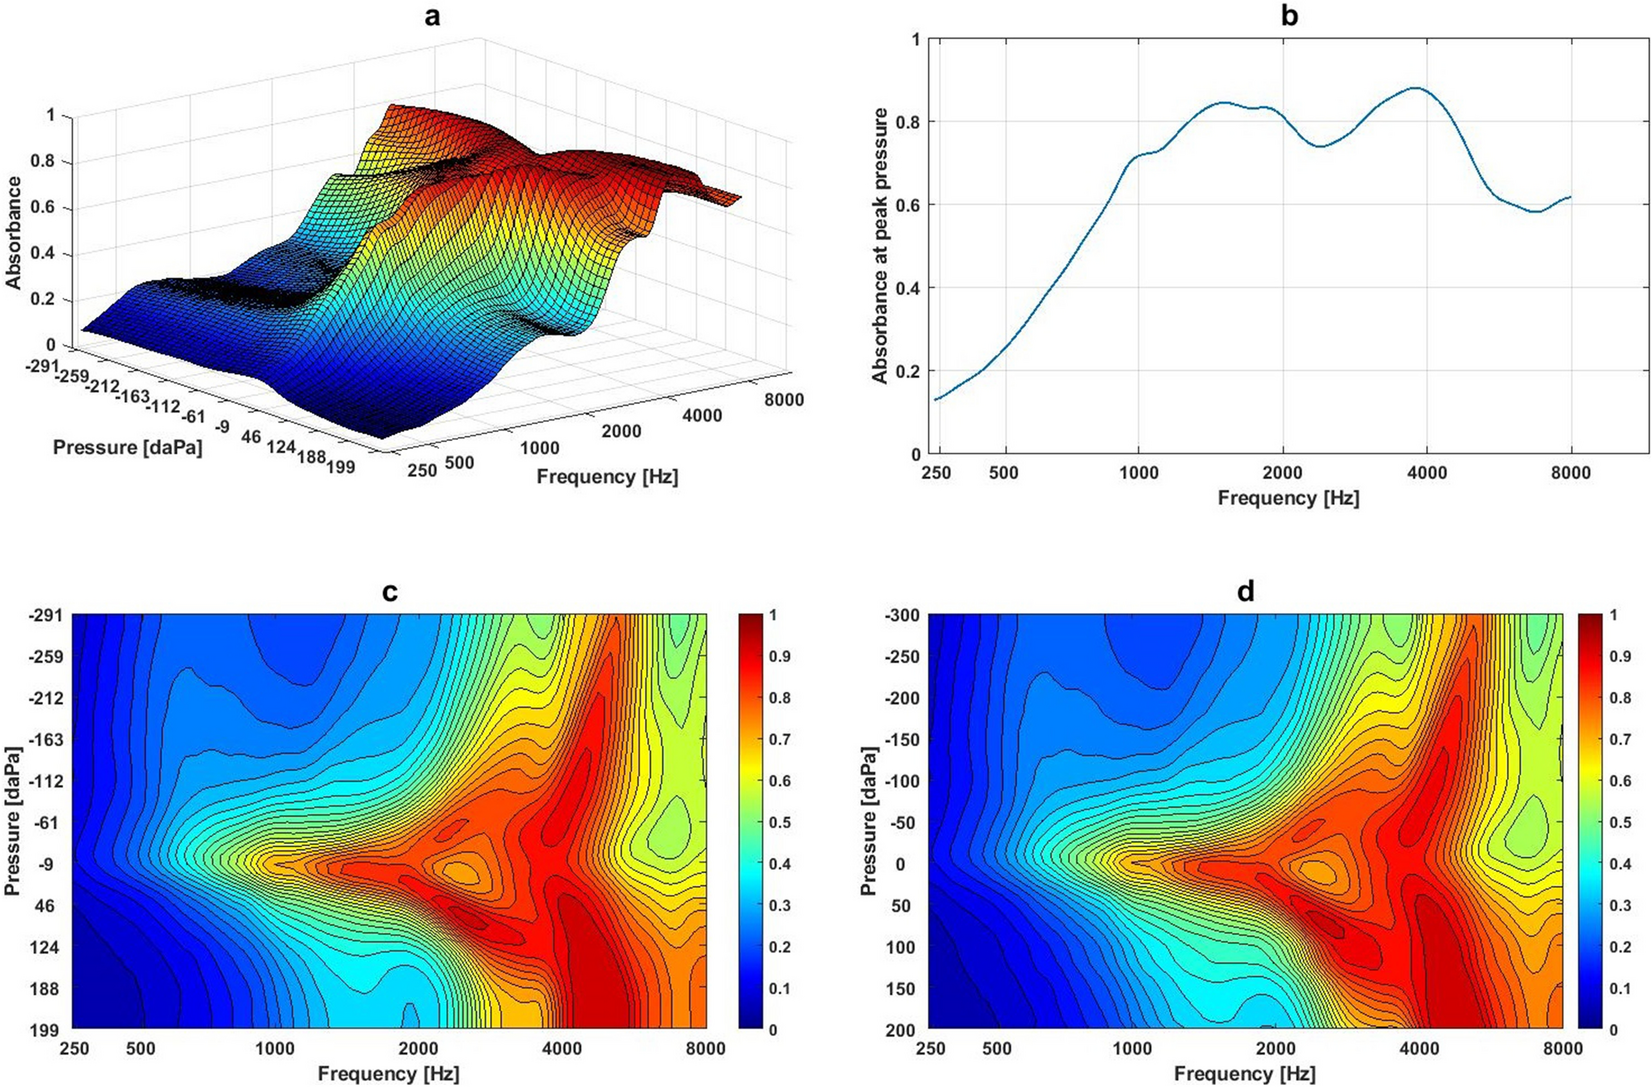
Figure 1

An example of the 3D WAI image and data pre-processing: (a) An example of 3D WAI data obtained from a participant with normal middle ear function aged 22; (b) the 2D frequency-absorbance plot at the peak pressure obtained from same participant; (c) the 2D frequency-pressure image converted from the 3D WAI in Fig. 1a; (d) the 2D frequency-pressure image converted from the 3D WAI in (a) after interpolating the pressure values on the Y-axis.
