
Figure 5
From: Measurement of stretch-evoked brainstem function using fMRI
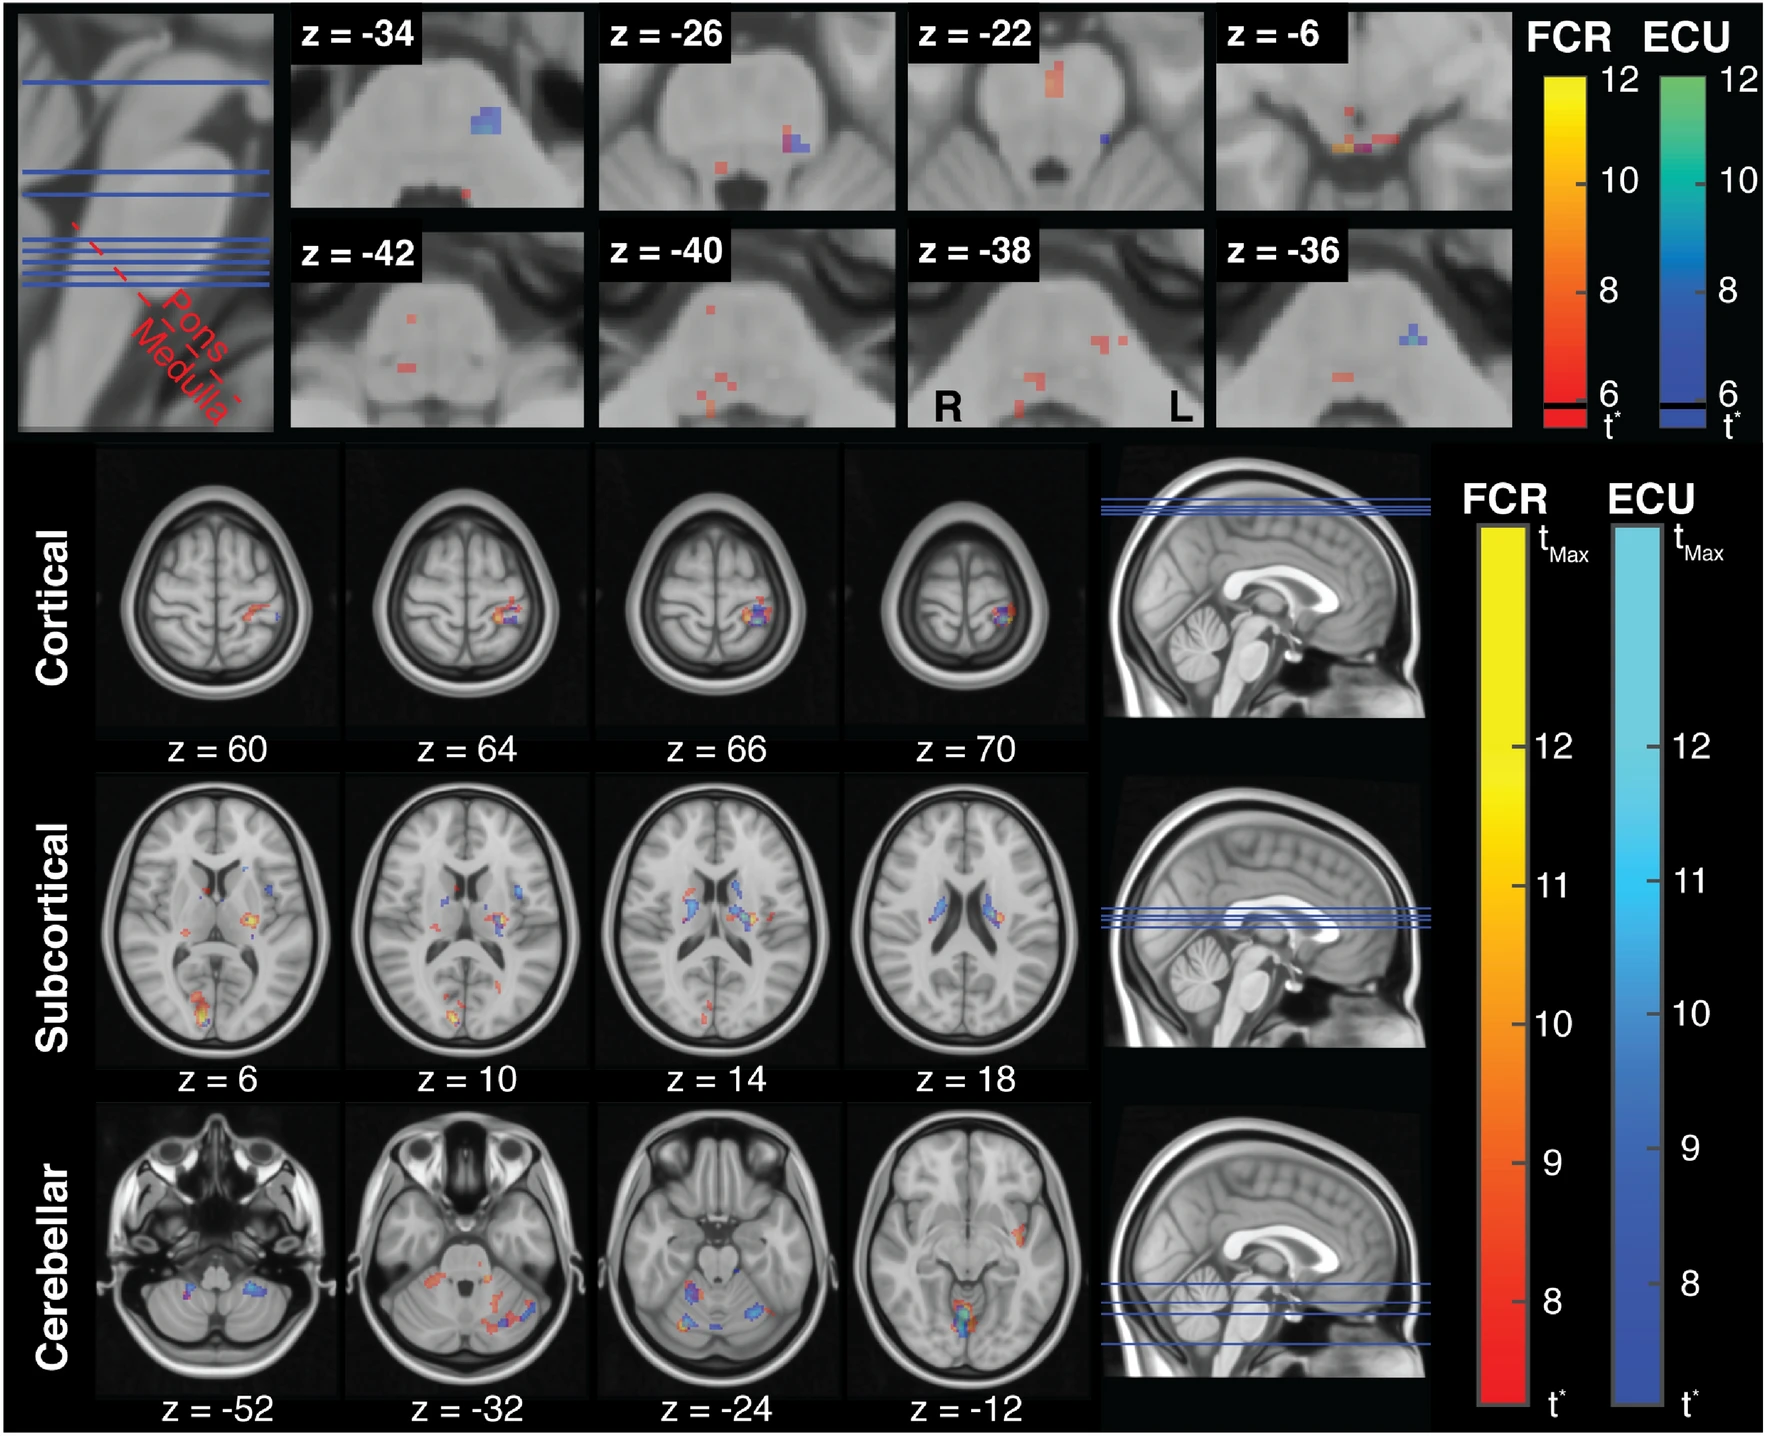
(Top) LLR-specific activation maps in the brainstem for FCR and ECU, with overlaid the plane of demarcation used to refer to voxels as being in the pons or in the medulla. The maps refer to contrasts \(\beta _{\text {FCR}}>0\) and \(\beta _{\text {ECU}}>0\) obtained for the brainstem-specific analysis. The threshold t-statistic, obtained after FWE correction, was equal 5.62 for both regressors. For reference, the t-statistic that refer to a Bonferroni correction (\(\text {t}_{\text {Bon}}\)= 5.8) is marked on each colorbar with a black line. (Bottom) LLR-specific activation maps in the whole-brain for FCR and ECU. The threshold t-statistic, obtained after FWE correction, was set to 7.25 and 7.09, respectively for FCR and ECU, while \(\text {t}_{{Max}}\) was equal to 14.95 and 15.54, respectively. Colorbars are saturated at \(t = 12\) for better visualization of t-statistic gradients. All statistical parametric maps are overlaid on axial slices of the standard Montreal Neurological Institute 152 template, with reported z coordinate in mm.
