
Figure 1
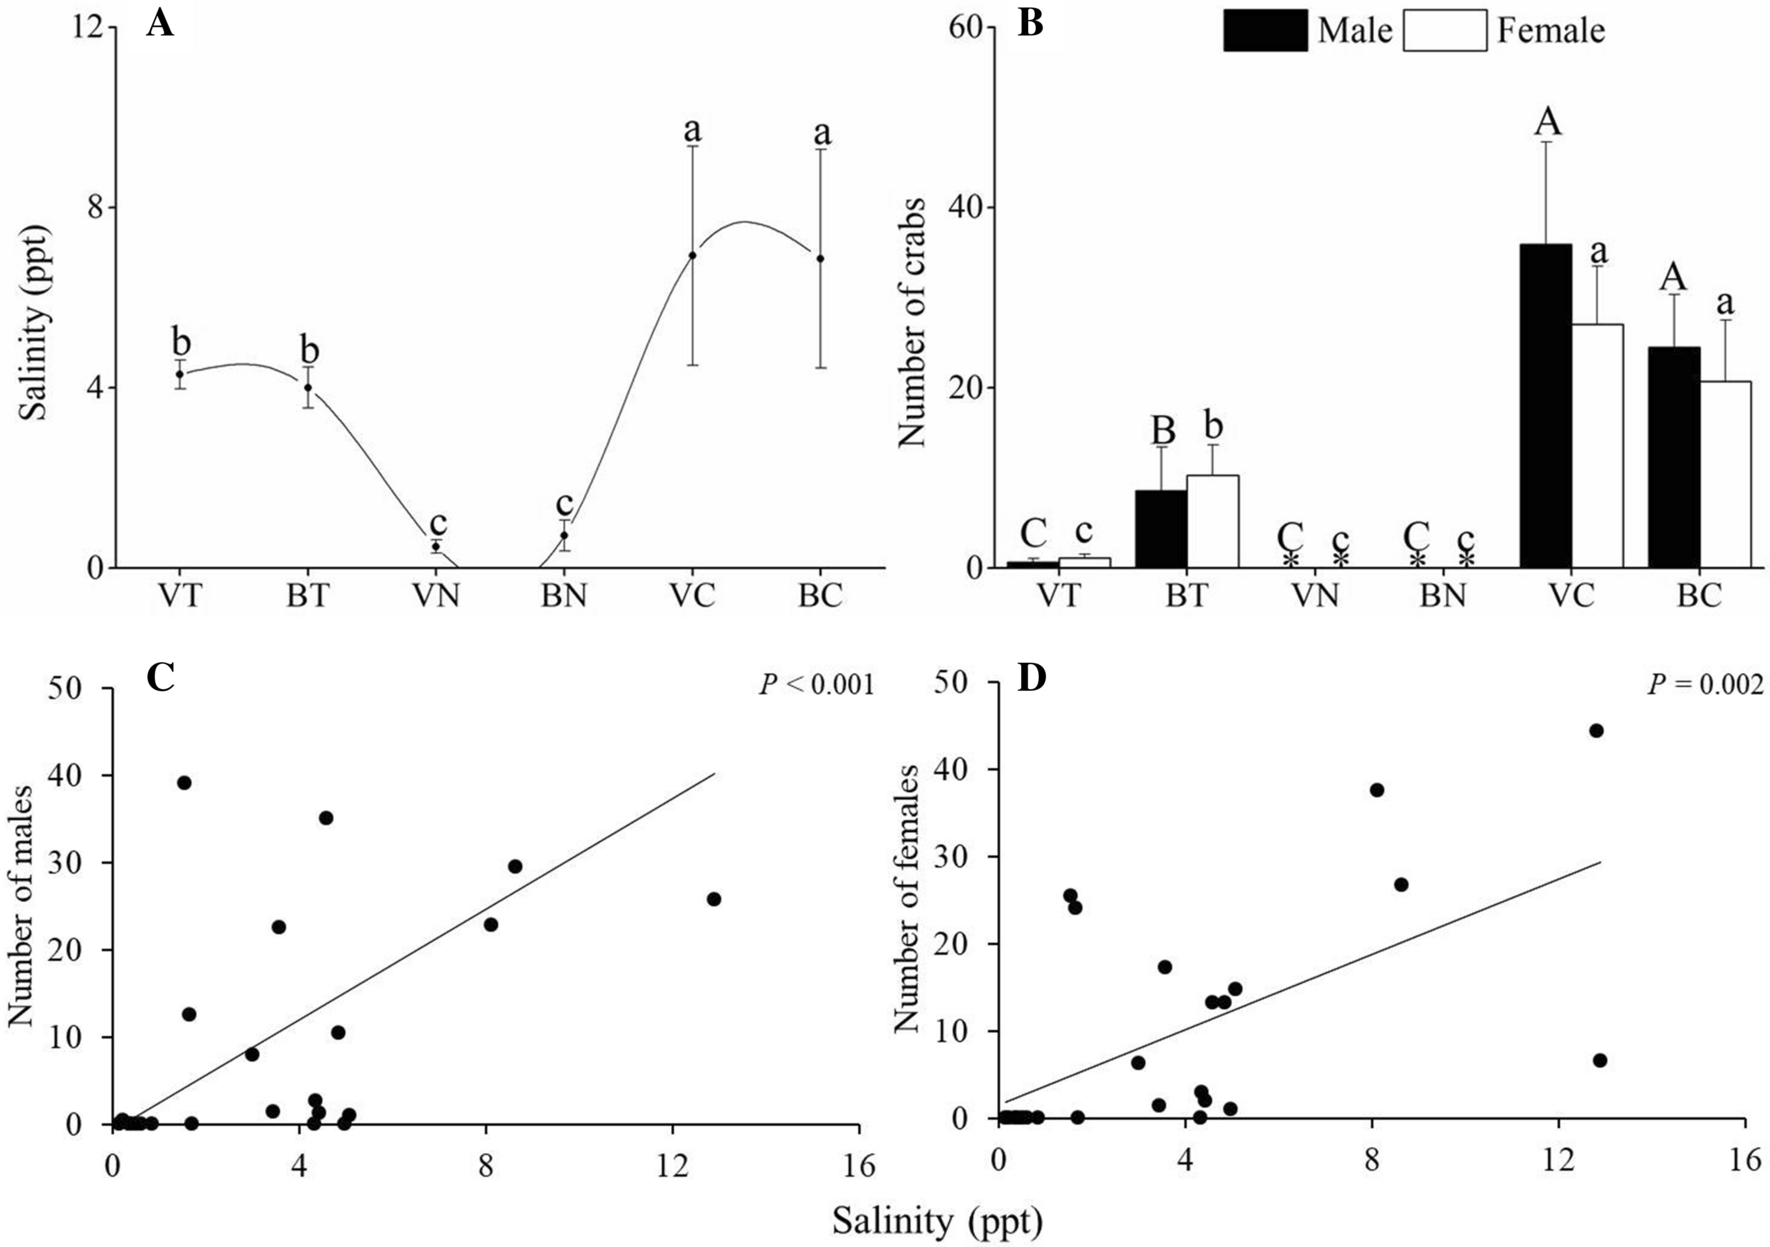
Water salinity (A) and number of C. dehaani crabs (B) in six sampling areas. Values are mean ± SE; N = 4. The correlations between water salinity and numbers of male (C) and female (D) crabs. The abbreviations represent sampling sites: VT and BT, vegetated and bald sites in tidal-affected region; VN and BN, vegetated and bald sites in non–tidal-affected region; VC and BC, vegetated and bald sites BC in natural tidal flat. * indicates that the number of crabs was 0.
