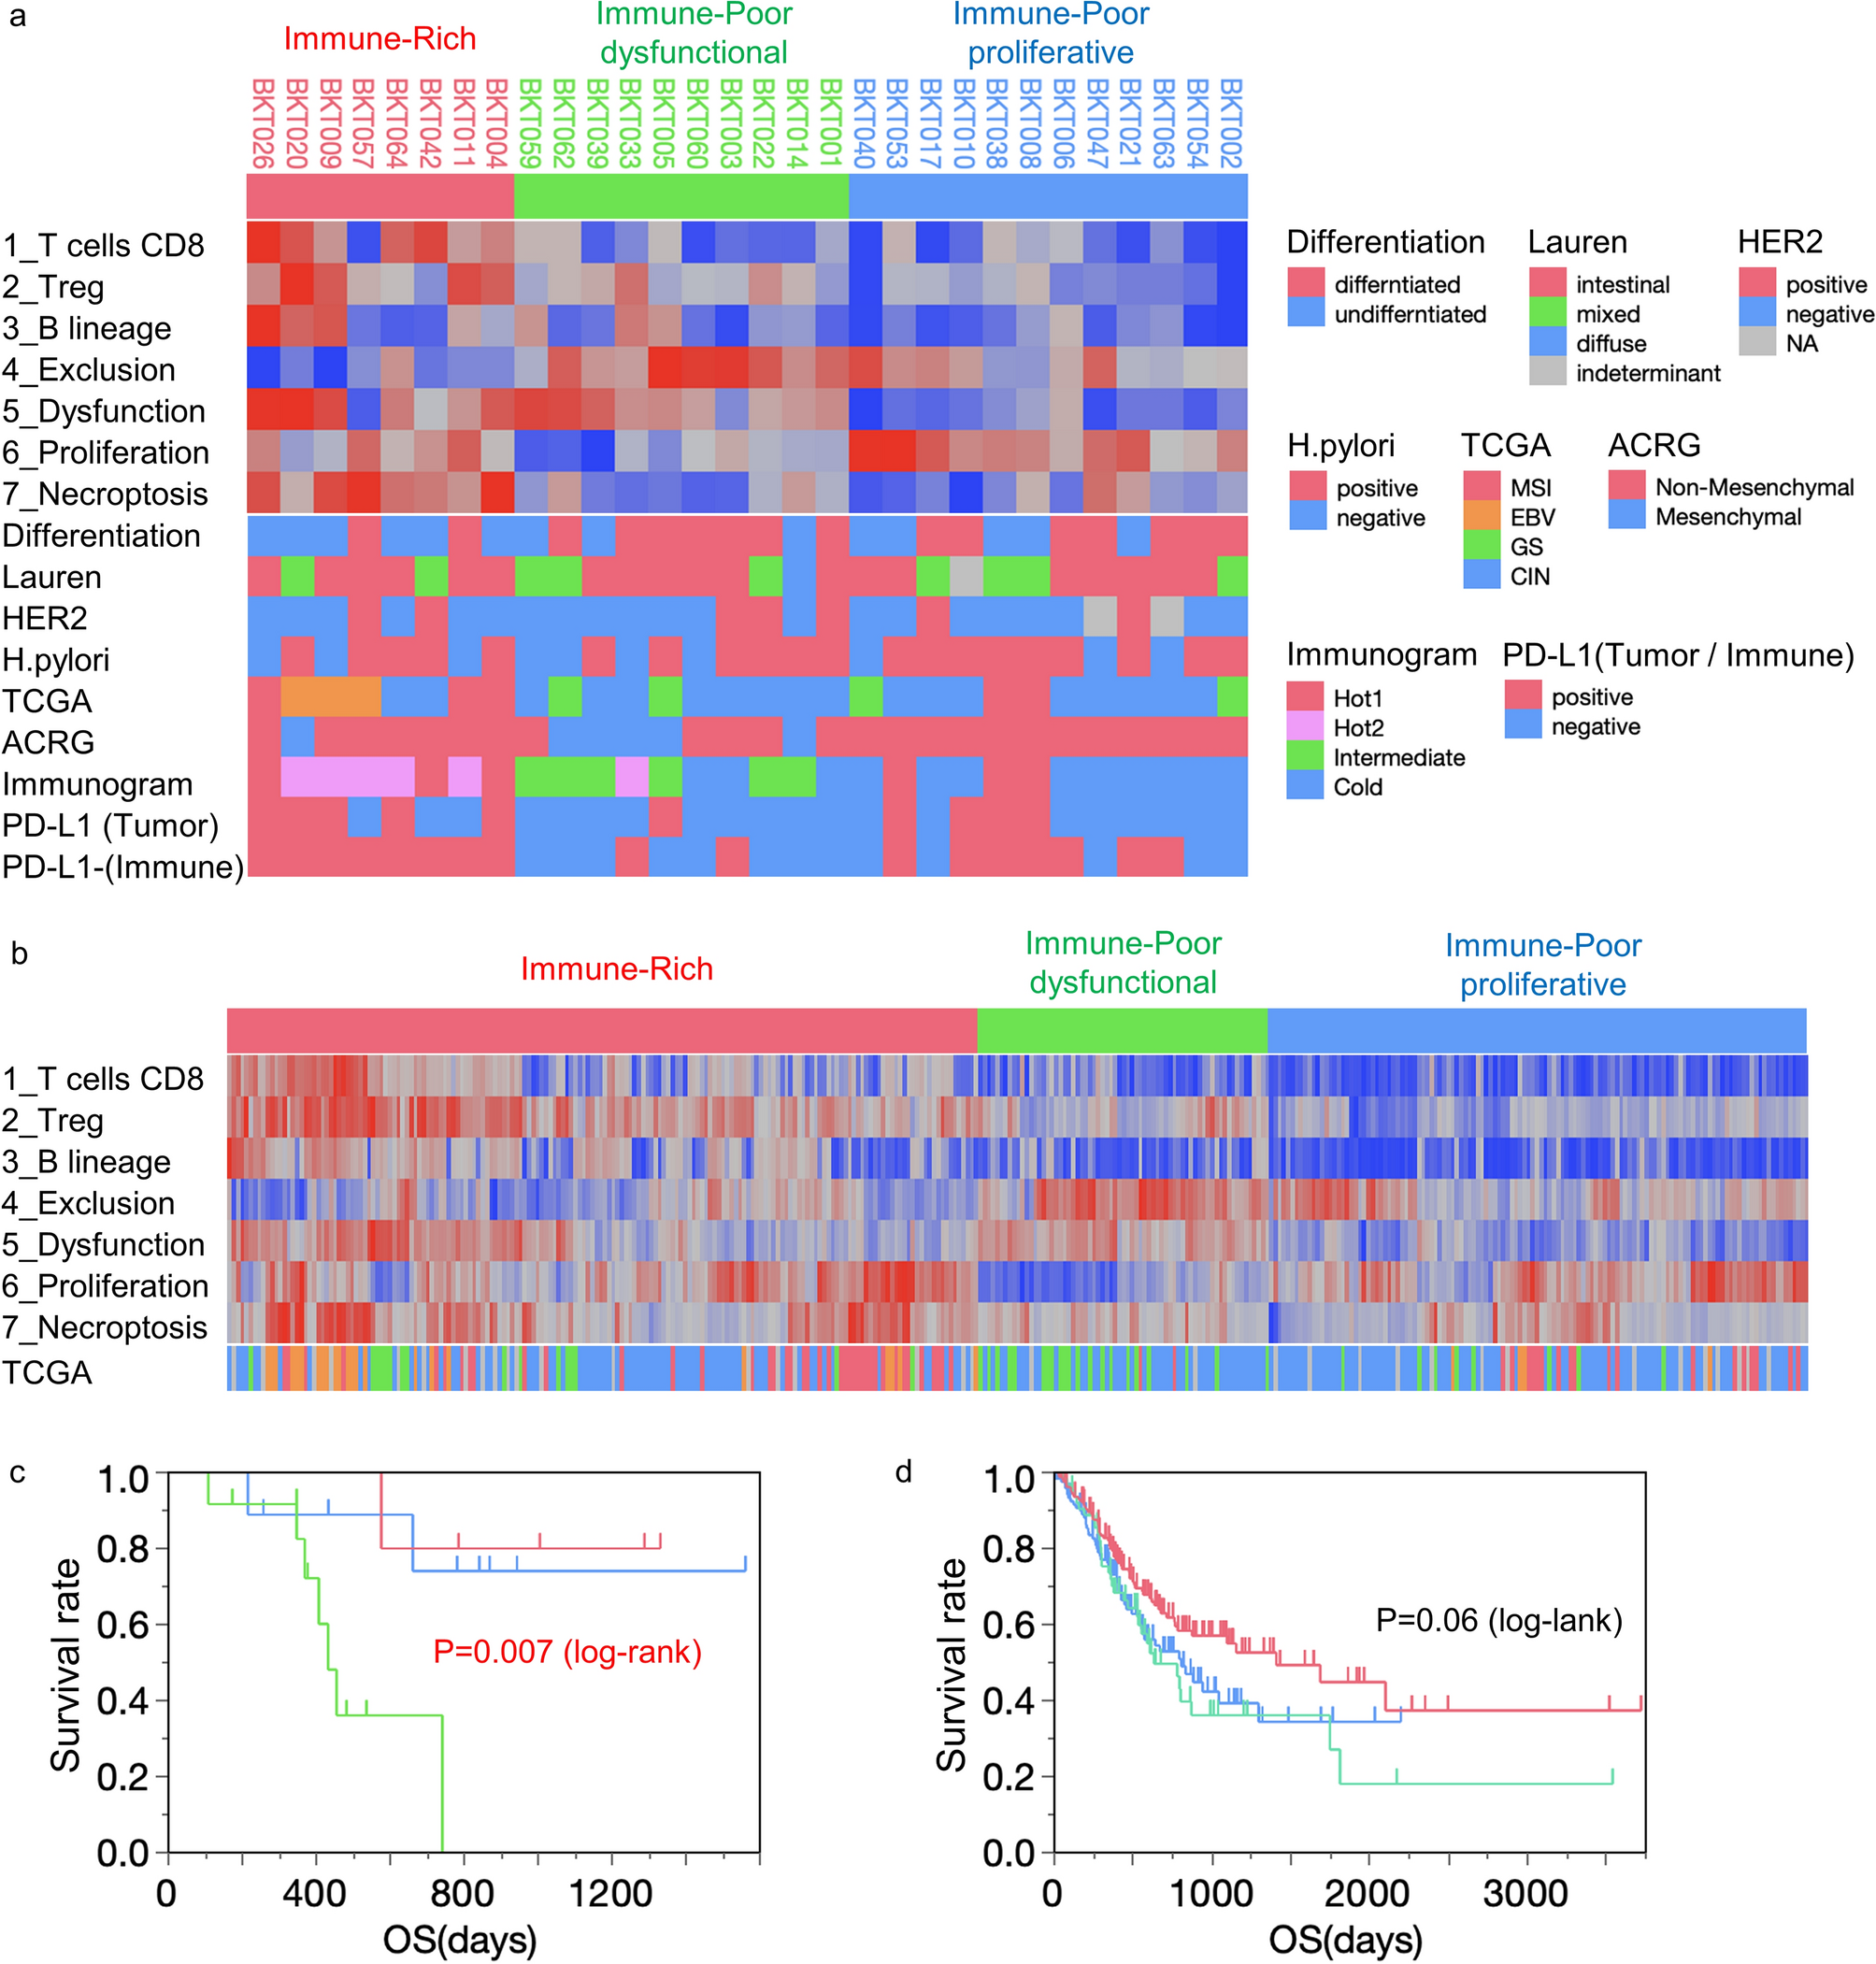
Figure 4

Transcriptome-based TME analysis with selected reliable gene sets in gastric cancer. (a) Hierarchical cluster analysis was performed in our 30 gastric cancer patients (BKT Cohort). The patients’ characteristics are shown in Table 1 and Supplementary Table S1. Degree of tumor differentiation, Lauren classification, HER2 status, Helicobacter pylori infection, TCGA subtype, the Asian Cancer Research Group (ACRG) Mesenchymal subtype15, Sato's immunogram classification (IGS)8 and PD-L1 IHC are displayed at the bottom. (b) Gastric cancer patients from the TCGA cohort (n = 375) were subjected to hierarchical clustering with 7 transcriptome-based TME analyses. The patients’ characteristics are shown in Tables S12-1 and S12-2. The molecular classification of TCGA is indicated at the bottom. Survival analysis for Immune-Rich (IR, red), Immune-Poor dysfunctional (IPd, green) and Immune-Poor proliferative (IPp, blue) groups. The Kaplan–Meier method and log-rank test were performed in BKT cohort (c) and TCGA cohort (d).
