Figure 1

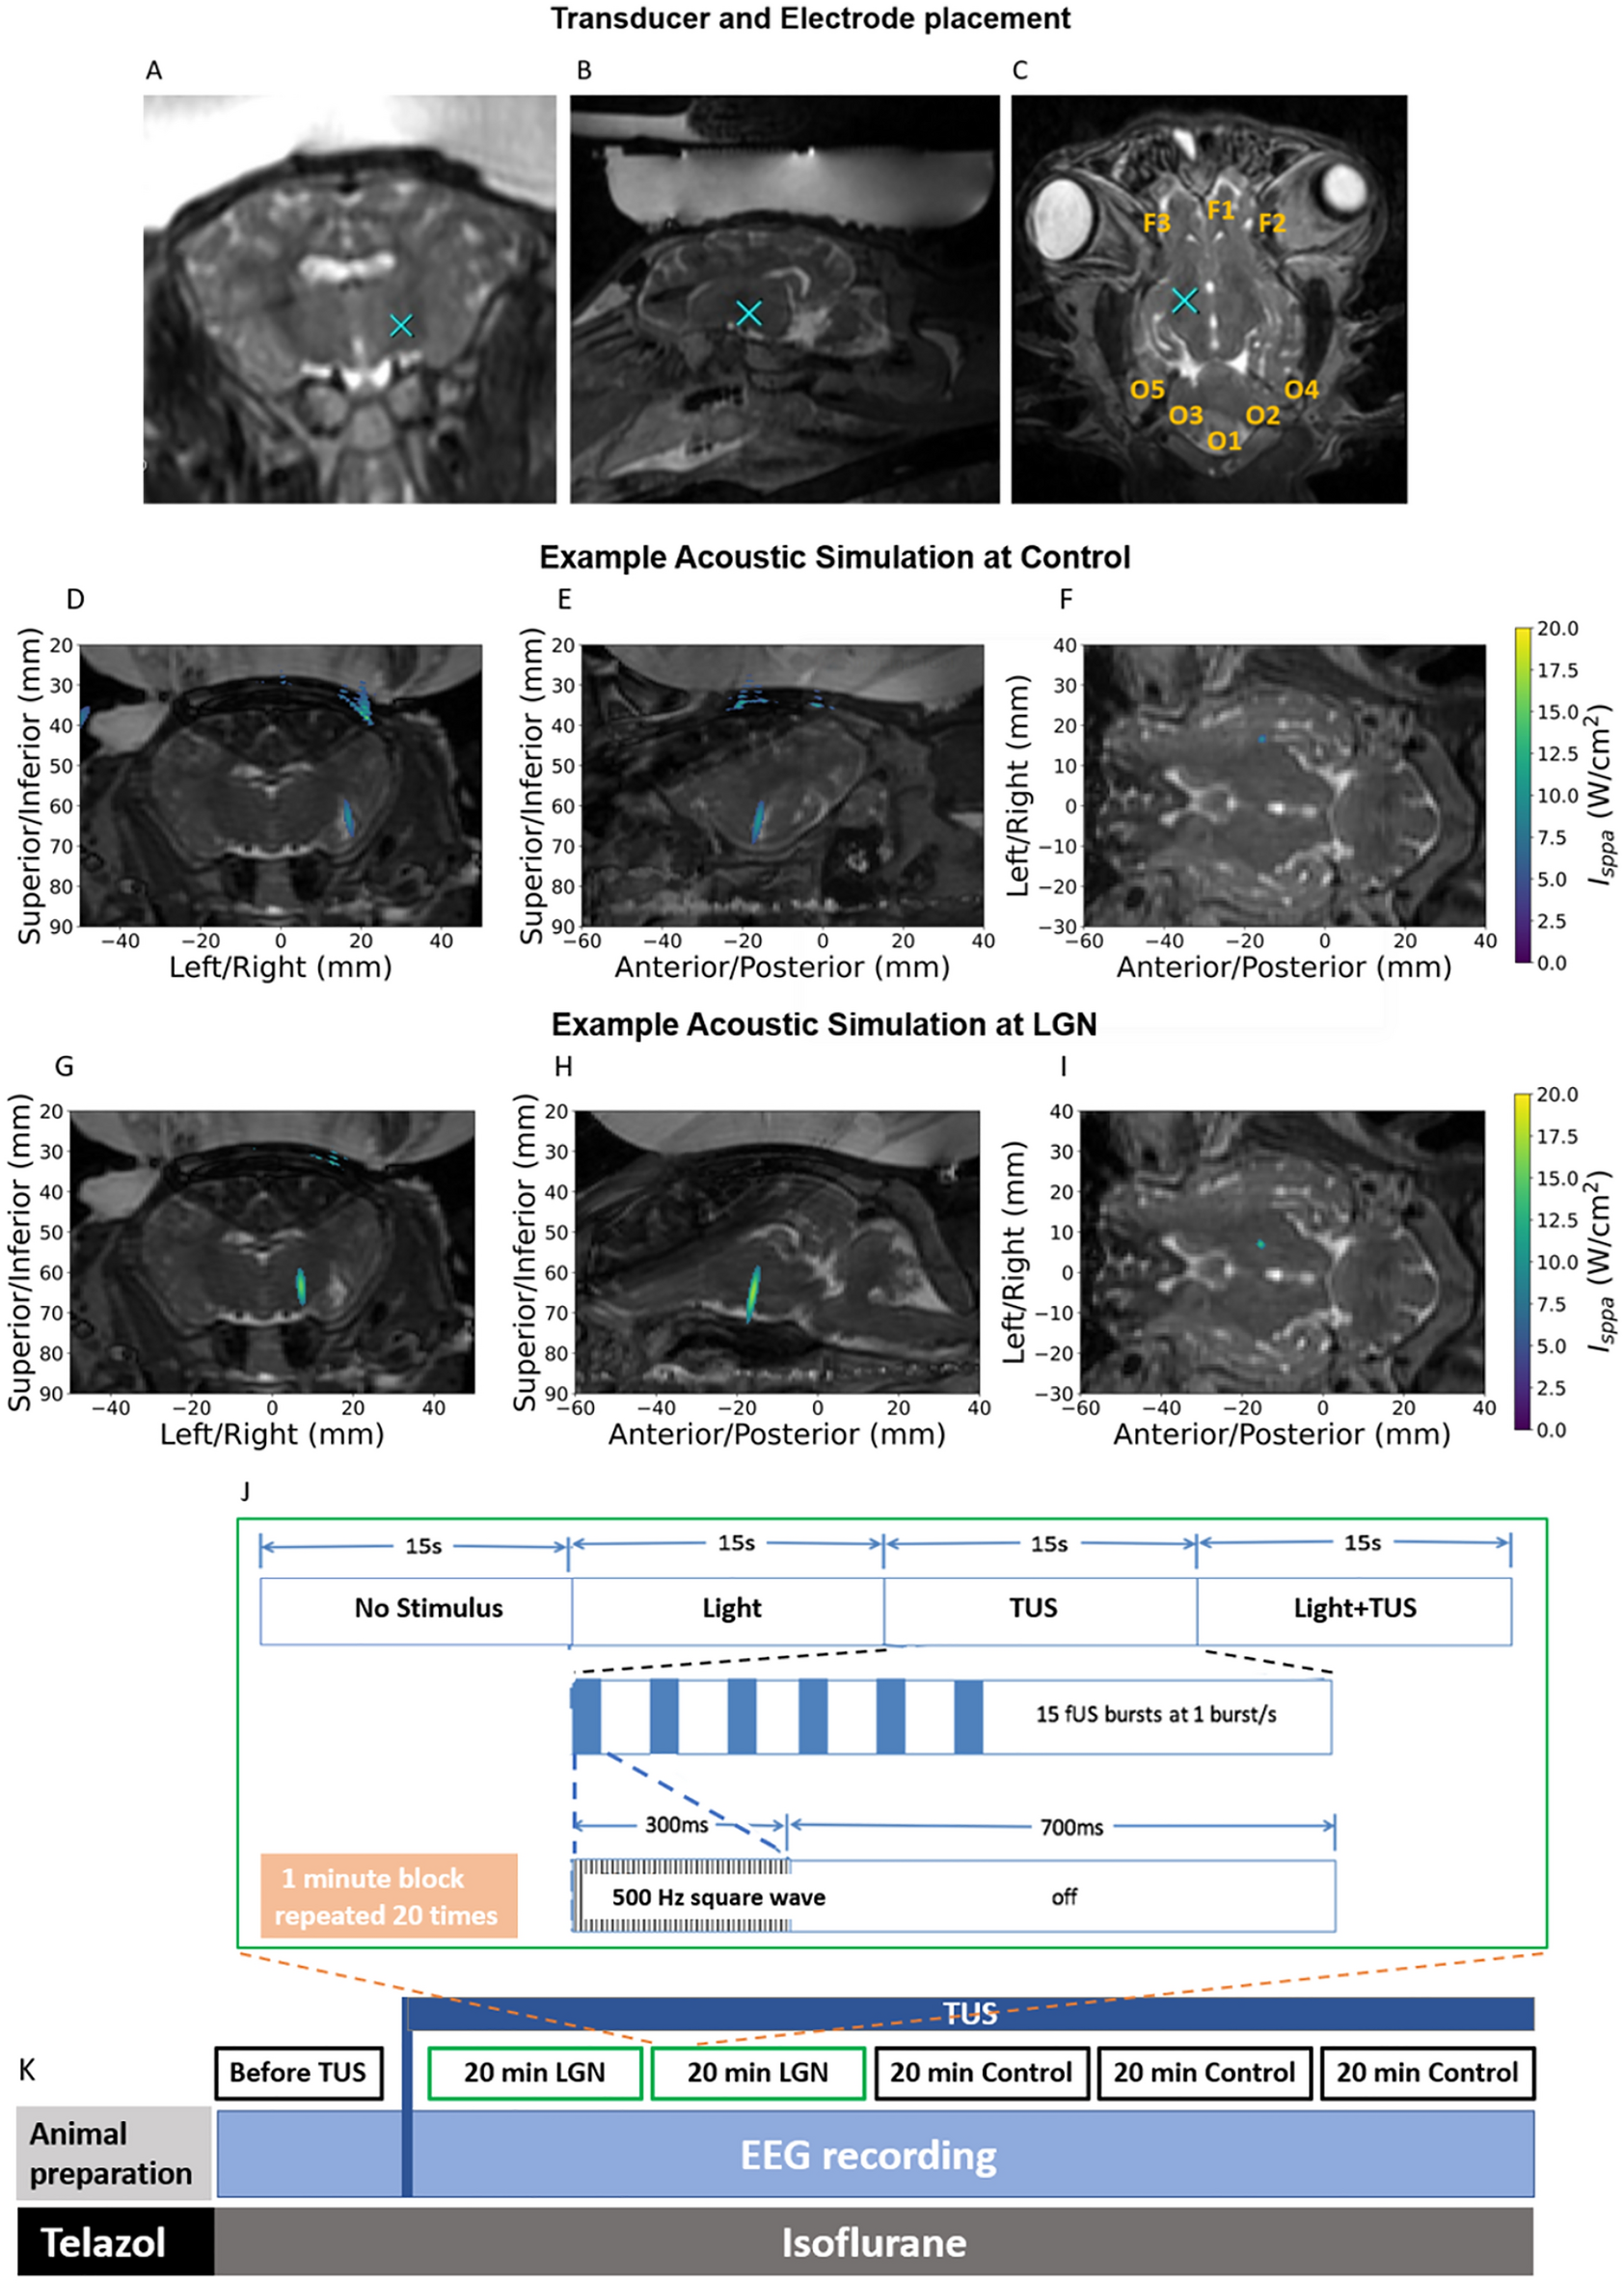
Imaging and experimental paradigm. Coronal (A), sagittal (B) and axial (C) MR images with TUS target location at control spot (blue X). The axial image (C) also shows the eight electrode locations where each electrode was extracranially placed 10 mm under the skin (orange labels). Acoustic intensities were simulated for example sonications using the hybrid angular spectrum method and overlaid on coronal (D), sagittal (E), and axial (F) MR images at control location, and (G), (H) and (I) at the LGN. In this particular example the intensity at the control location is slightly lower, however this was not always the case. Other than one experiment with substantial difference in intensity values due to a larger steering angle at control, the intensity values are comparable. Each 20-min block (J) was split into 20 sections, each with four 15 s conditions consisting of 1) no stimulus, 2) light stimulus only, 3) TUS-only, and 4) light stimulus-plus-TUS. For each 15-s condition the repetition frequency of the stimulus was 1 flash/s. The ultrasound stimuli were 300 ms pulse trains of square waves of 50% duty cycle, repeated every second. The visual stimuli were 20 ms white-light flashes (binocular at 1 Hz). The block diagram of the entire experiment timeline is shown (K). Before applying TUS, baseline VEPs were recorded for 5 min. Then the 20 min block was applied with sonication directed to either left or right LGN. This was repeated for a second 20 min block. At that point, the sonication was directed to a control non-LGN location (10 mm anterior to LGN, medial putamen and adjacent internal capsule) for three blocks. EEG was recorded continuously during each block.
