Figure 1

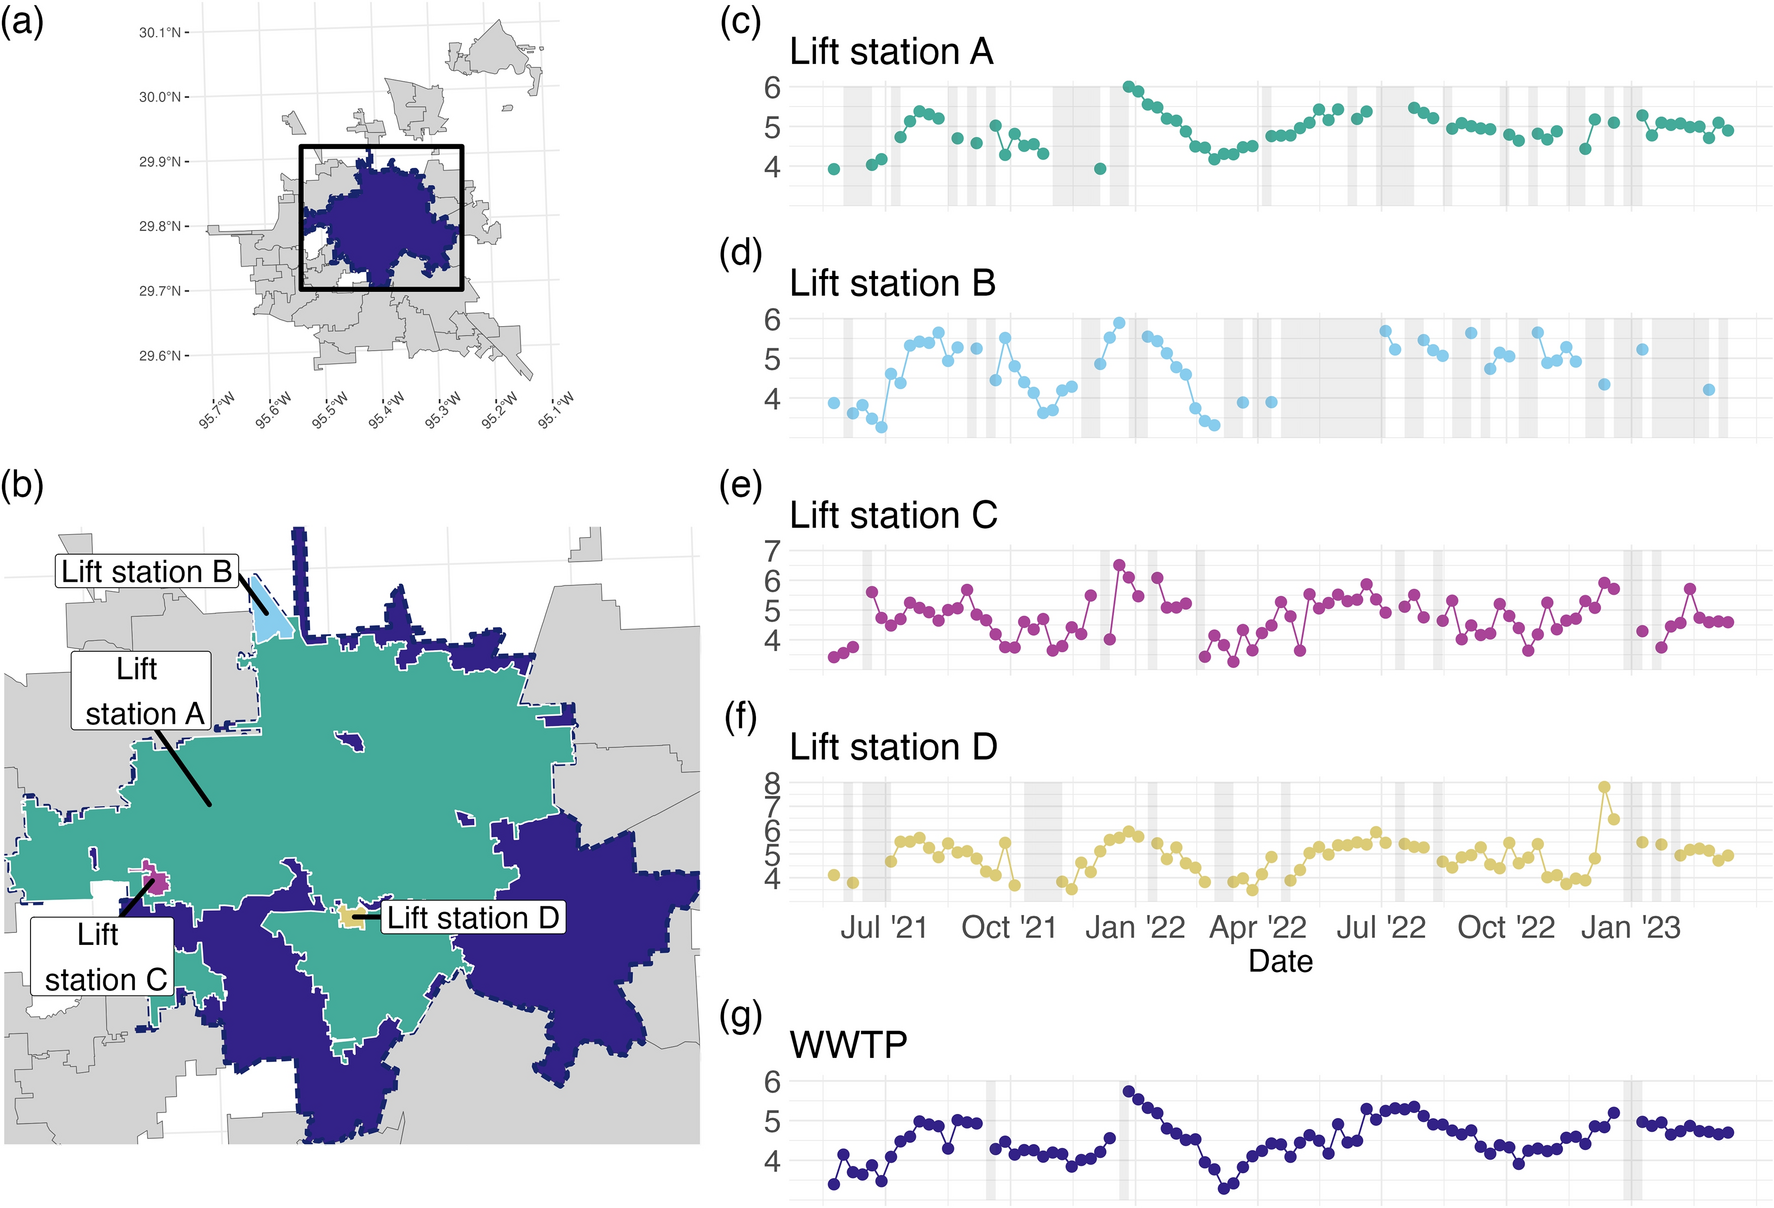
(a) The WWTP catchment areas for the City of Houston, with the WWTP of focus shaded. The box shows the extent of (b), the map showing the 4 lift stations considered in the analysis. (c–g) Plot the time series of Log10 Copies/L for the WWTP and the 4 lift station facilities, referred to as Lift Station A–D, with periods of missing values indicated by grey rectangles.
