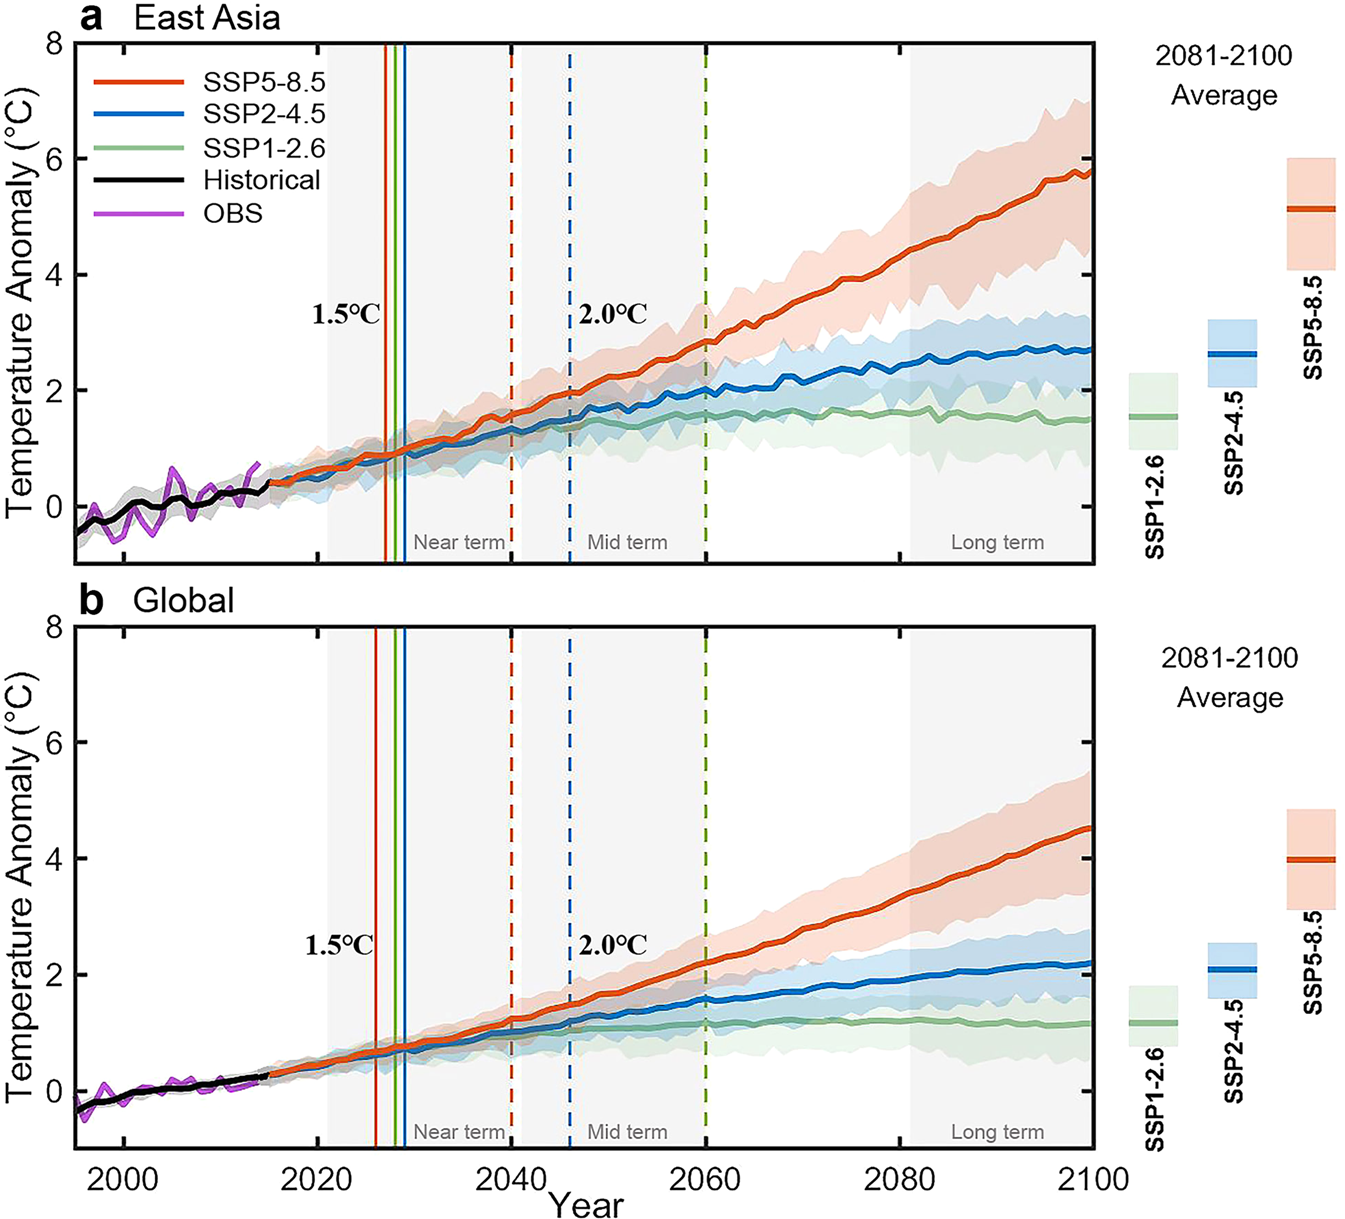
Fig. 1: Projections of temperature change (°C) relative to the reference period 1995–2014 for observations (ERA5 reanalysis) (purple), historical (black), SSP1–2.6 (green), SSP2–4.5 (blue) and SSP5–8.5 (red) scenarios.
From: Recent frontiers of climate changes in East Asia at global warming of 1.5°C and 2°C

a For the East Asia and b for the global. For each scenario, the median (solid lines) and the 17–83% likely range (shading) are shown. The bar plots on the right side of each panel represent the median (solid lines) and 17–83% likely range of the projections averaged over 2081–2100. Vertical lines at GW1.5/2 represent the time when mean global-scale warming reaches 1.5 °C/2 °C relative to pre-industrial levels (1850–1900).
