
Fig. 1: Consort diagram.
From: Unveiling overeating patterns within digital longitudinal data on eating behaviors and contexts
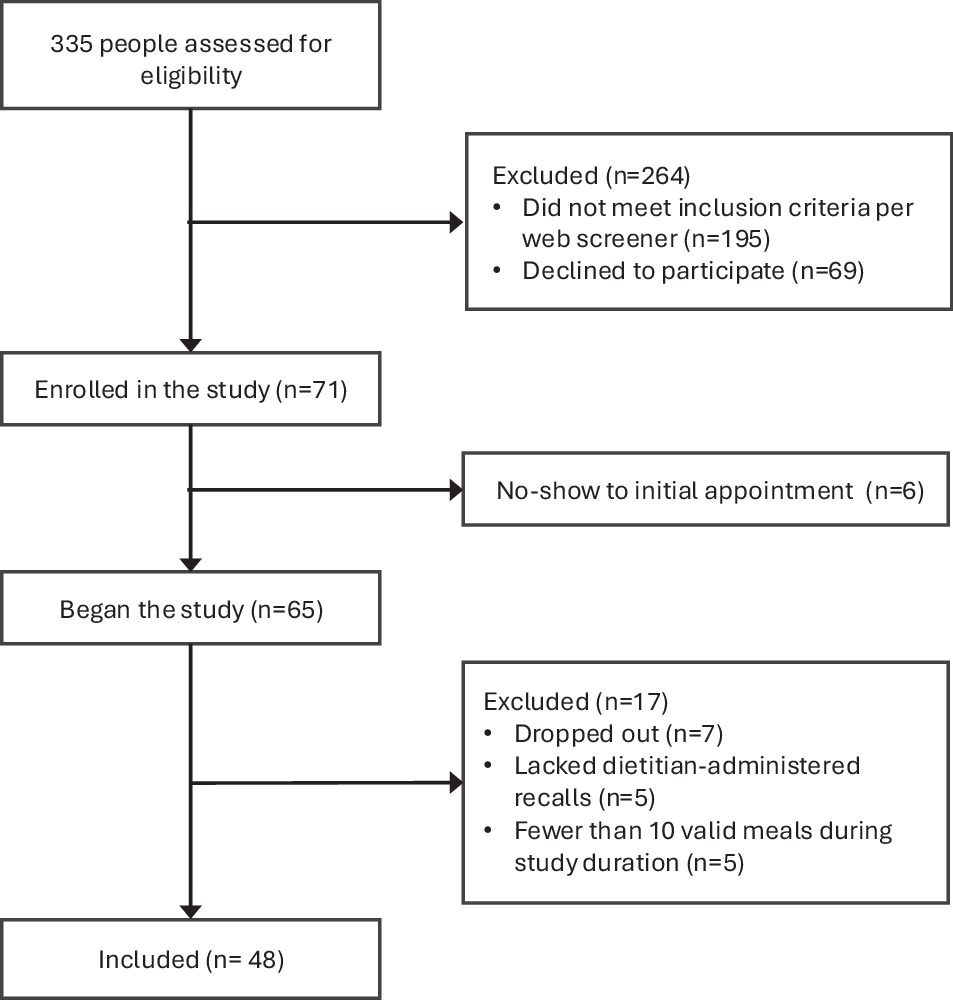
This figure presents the participant flow through the study, from initial recruitment to final analysis, showing the number of participants at each stage (screened, enrolled, and included in the analysis) and the reasons for exclusions at various points.
