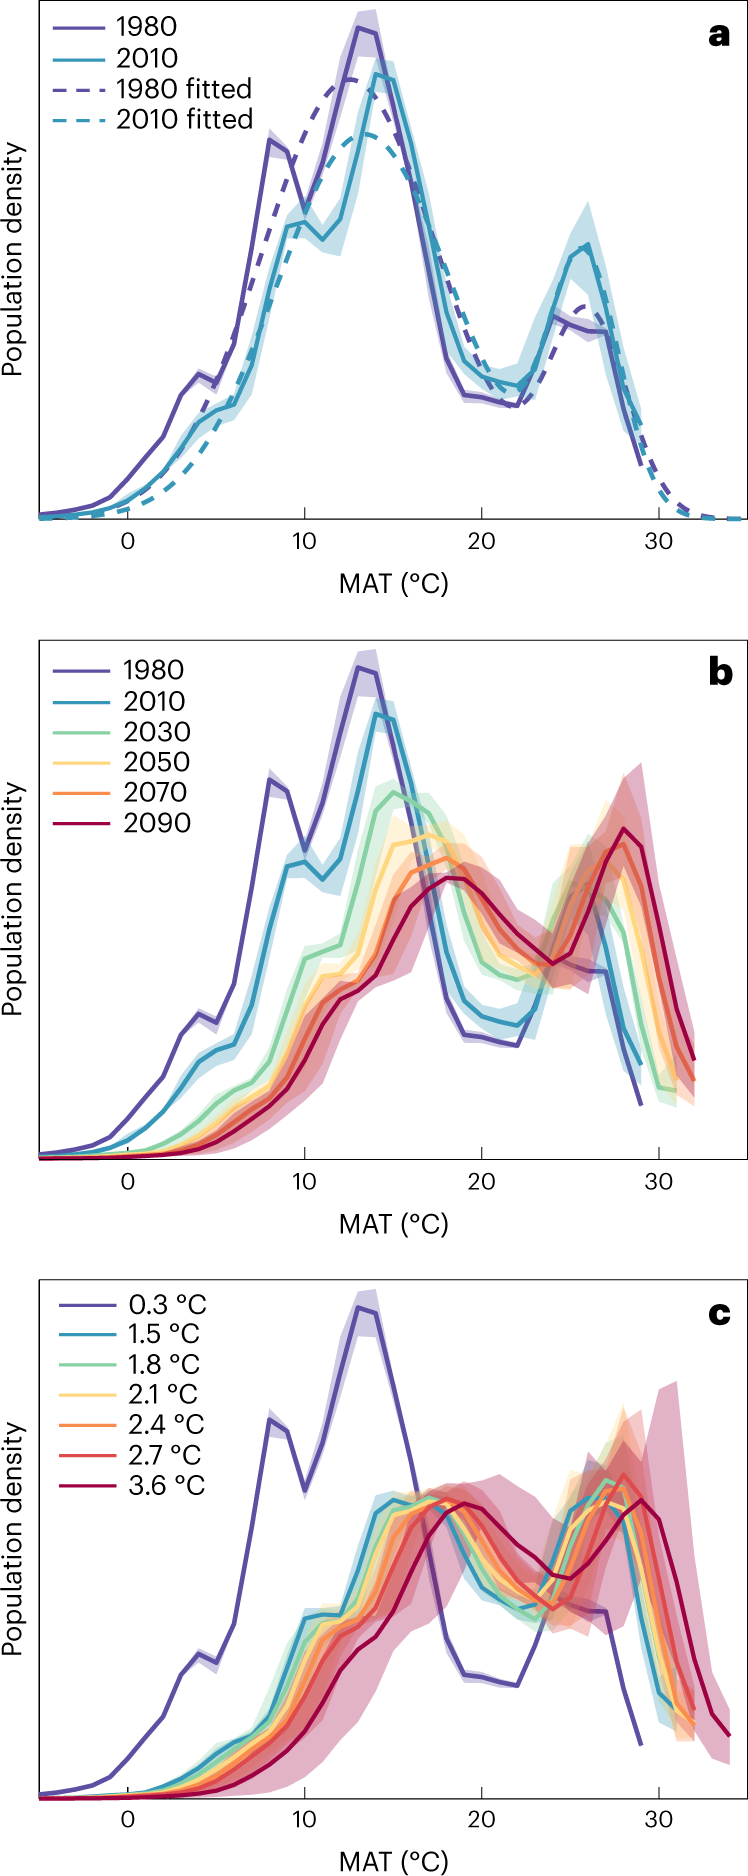
Fig. 1: Changes in relative human population density with respect to MAT.

a, Observed changes from the reference distribution for 1980 population (4.4 billion) under 1960–1990 climate (0.3 °C global warming), to the 2010 population (6.9 billion) under 2000–2020 climate (1.0 °C global warming), together with smooth fitted functions (‘1980 fitted’ is defined as the temperature niche). b, Observed and projected future changes in population density with respect to MAT following SSP2-4.5 leading to ~2.7 °C global warming and peak population 9.5 billion (see Extended Data Table 1 for global warming and population levels at each time). c, Projected population density with respect to MAT for a future world of 9.5 billion people under different levels of global warming (1.5, 1.8, 2.1, 2.4, 2.7 and 3.6 °C), contrasted with the reference distribution (0.3 °C, 1980 population). Data are presented as mean values with the shaded regions corresponding to 5th–95th percentiles.
