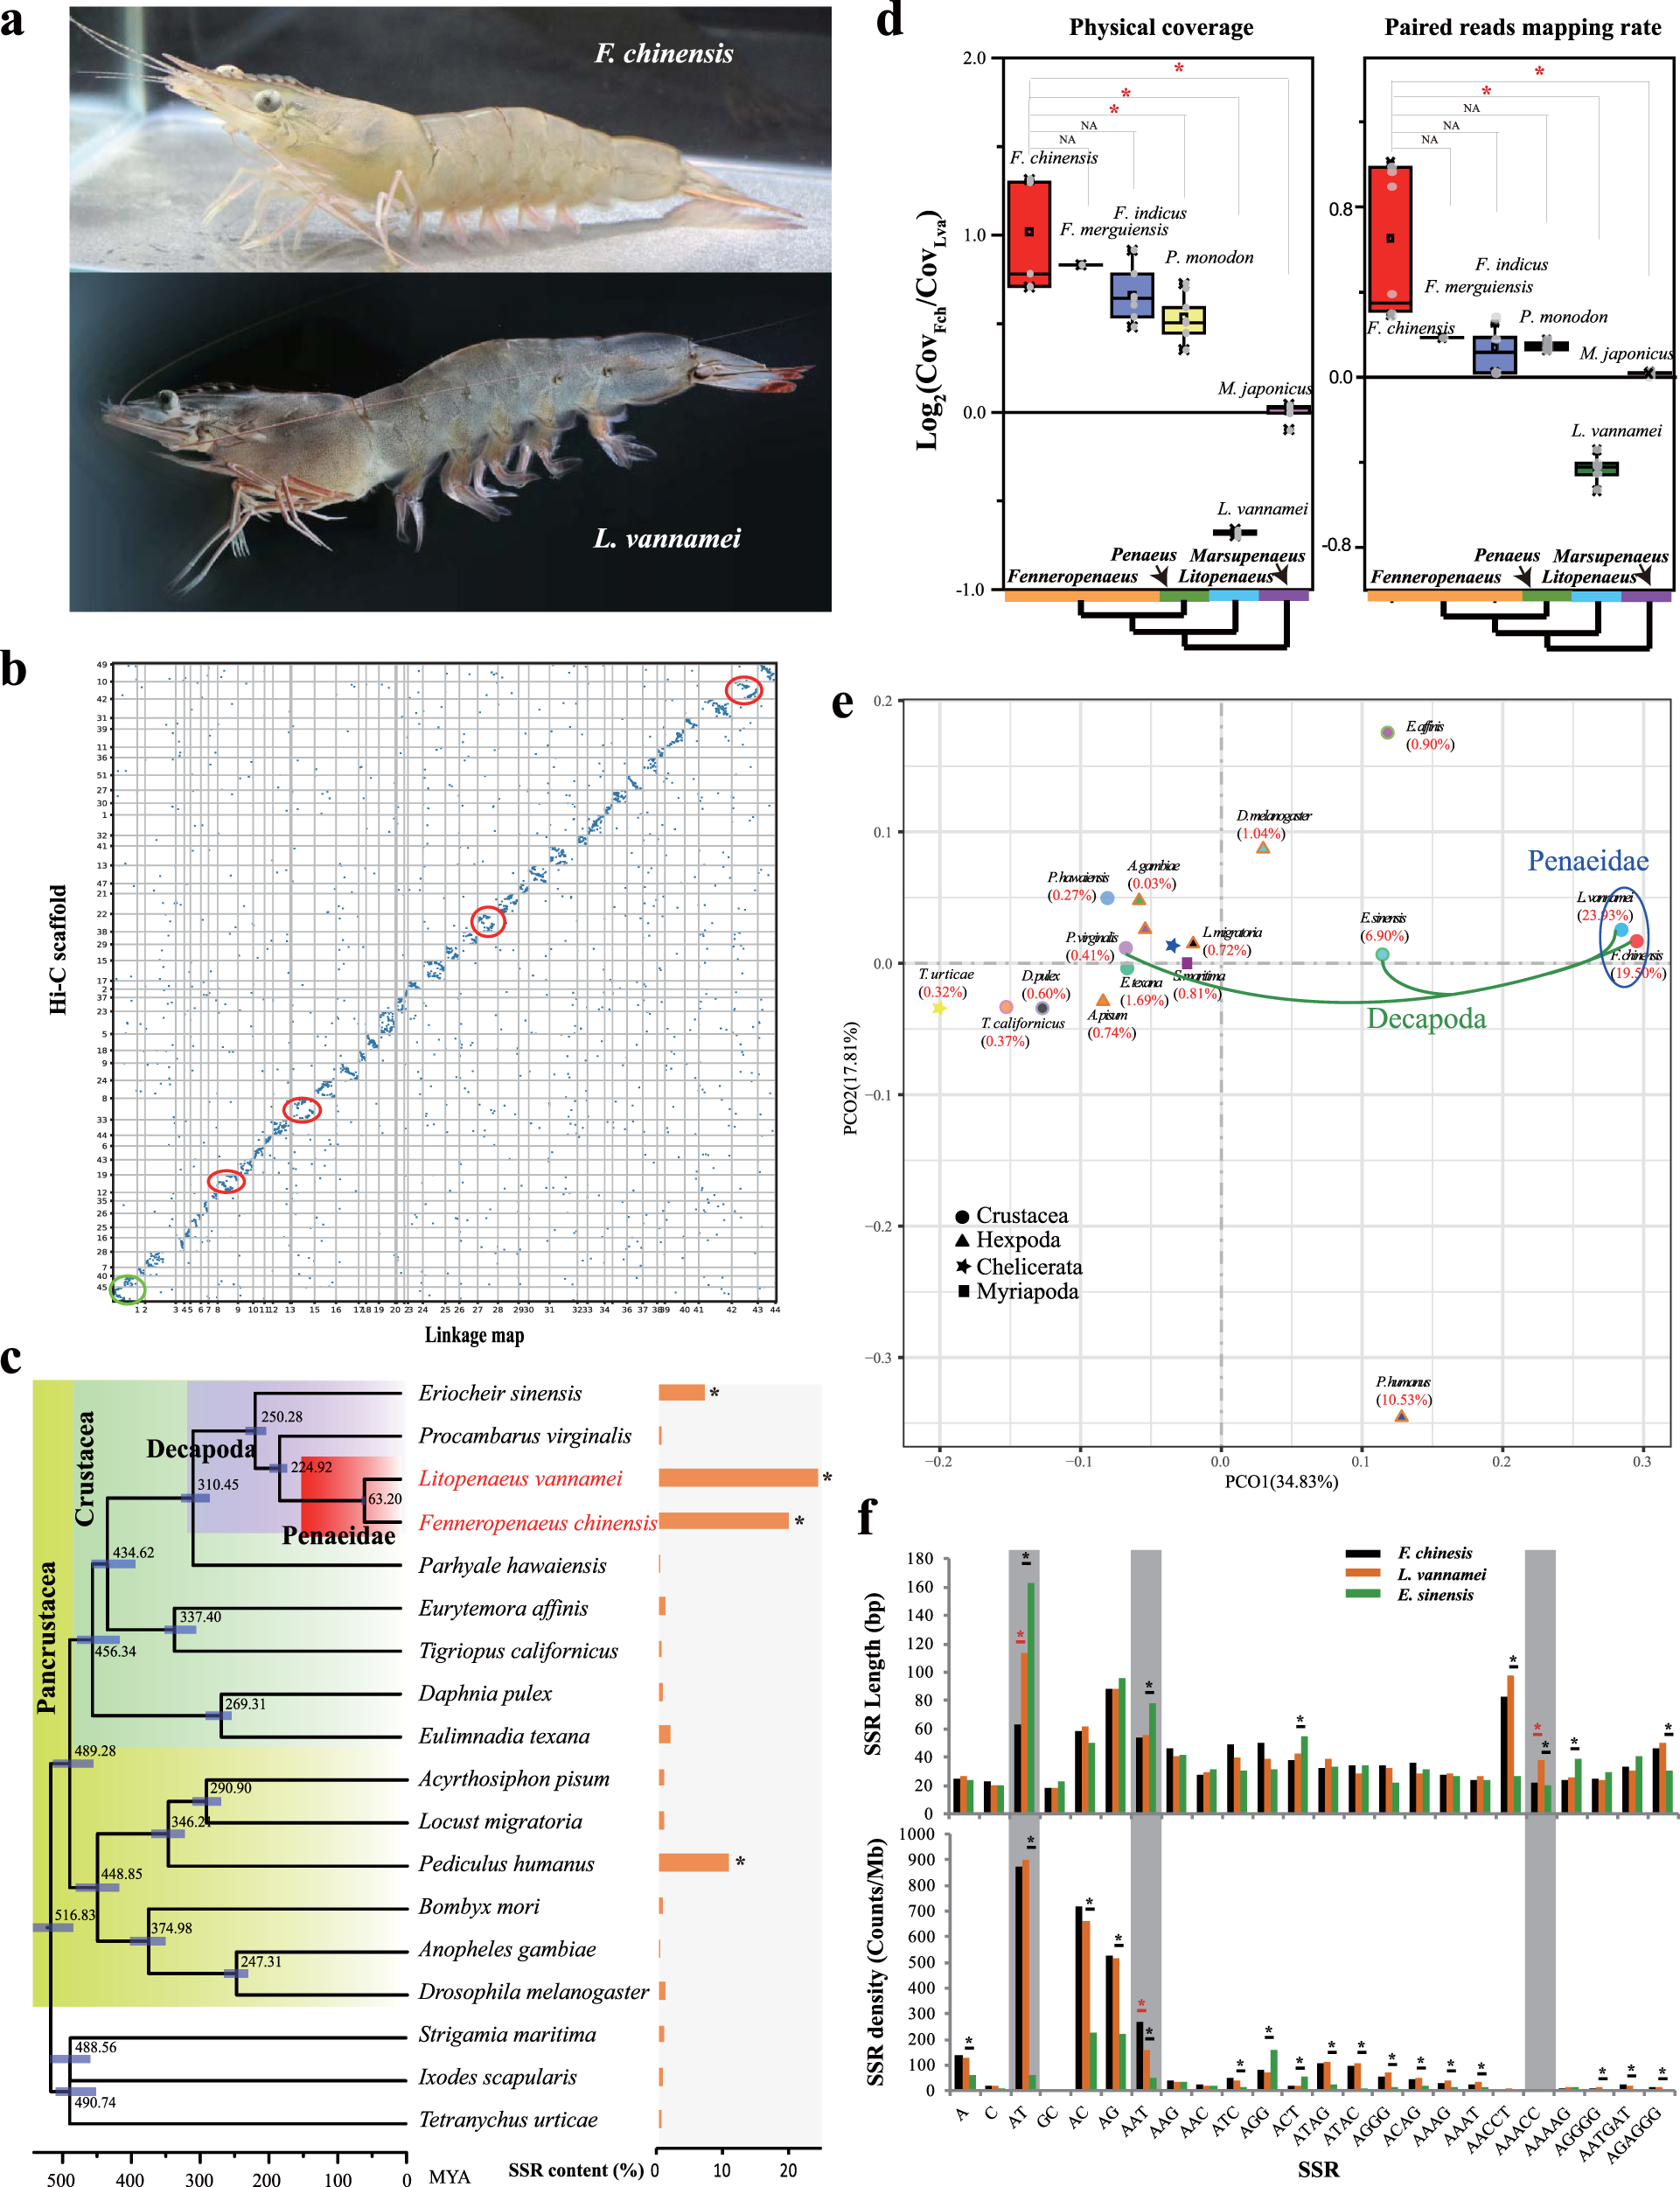
Fig. 1: Comparative genomics of penaeid shrimp and other arthropods.
From: Simple sequence repeats drive genome plasticity and promote adaptive evolution in penaeid shrimp

a The pictures of F. chinensis and L. vannamei. b Synteny of the chromosome-level genomes assembled based on Hi-C data and a high-density linkage map of L. vannamei. Rearrangements were identified in four pseudochromosomes (red circles), and a Hi-C scaffold was found to be composed of two linkage groups (green circle). c Phylogenetic placement of penaeid shrimp in the arthropod phylogenetic tree. The numbers on the branches indicate the estimated divergence times (MYA). Error bars indicate 95% confidence levels. The SSR content for each species is shown in the right bar plot. d Comparison of the physical coverage and read mapping rates of the two penaeid shrimp genomes based on the Illumina sequencing data of various penaeid shrimp species. A positive value of log2(CovFch/CovLva) indicates that the genome sequences of the corresponding species were more similar to that of F. chinensis, while a negative value indicates that the genome sequences of the corresponding species were more similar to that of L. vannamei. The line indicates the median value, the square symbol indicates the mean, the upper and lower box edges indicate the 75% and 25% quartiles, respectively, and the “X” indicates the outliers. * indicates significant difference between two groups of values (p < 0.01). e Principal component analysis (PCA) of SSR composition among arthropod genomes. f Comparison of SSR length and density of each type among three decapod genomes. The orange star indicates a significant variation (p < 0.05) between F. chinensis and L. vannamei, and the black star indicates a significant variation between L. vannamei and E. sinensis.
