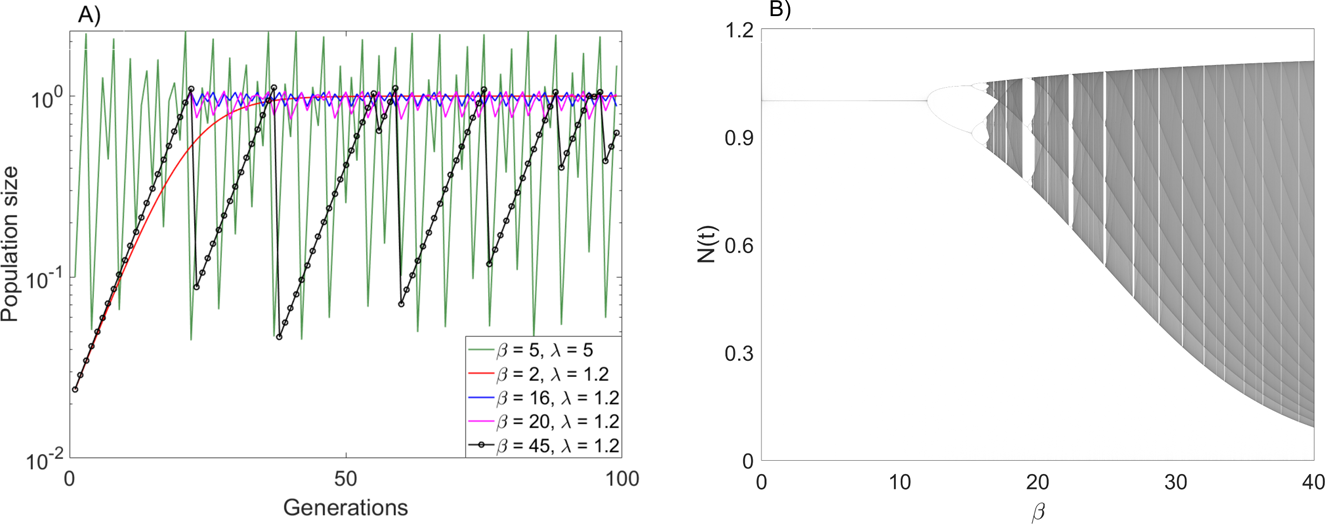
Fig. 1: The dynamic complexity of the basic model.
From: Boom-bust population dynamics increase diversity in evolving competitive communities

A Examples of population dynamics generated by model (2). Shown are convergence to steady state for β = 2, λ = 1.2 (red line), stable periodic oscillations for β = 16, λ = 1.2 (blue line), chaotic dynamics when β = 20, λ = 1.2 (magenta line) and β = 5, λ = 5 (green line), and boom-bust chaotic dynamics when β = 45, λ = 1.2 (black line with individual generations shown by circles). Note the almost exponential multi-generation growth phases in the boom-bust regime, followed by a single-generation bust. B Bifurcation diagram for Eq. (2) for λ = 1.2. Both panels computed with K = 1.
