
Fig. 1: Meta-analysis of human studies reveals increased energy expenditure and shortened lifespan in primary mitochondrial diseases.
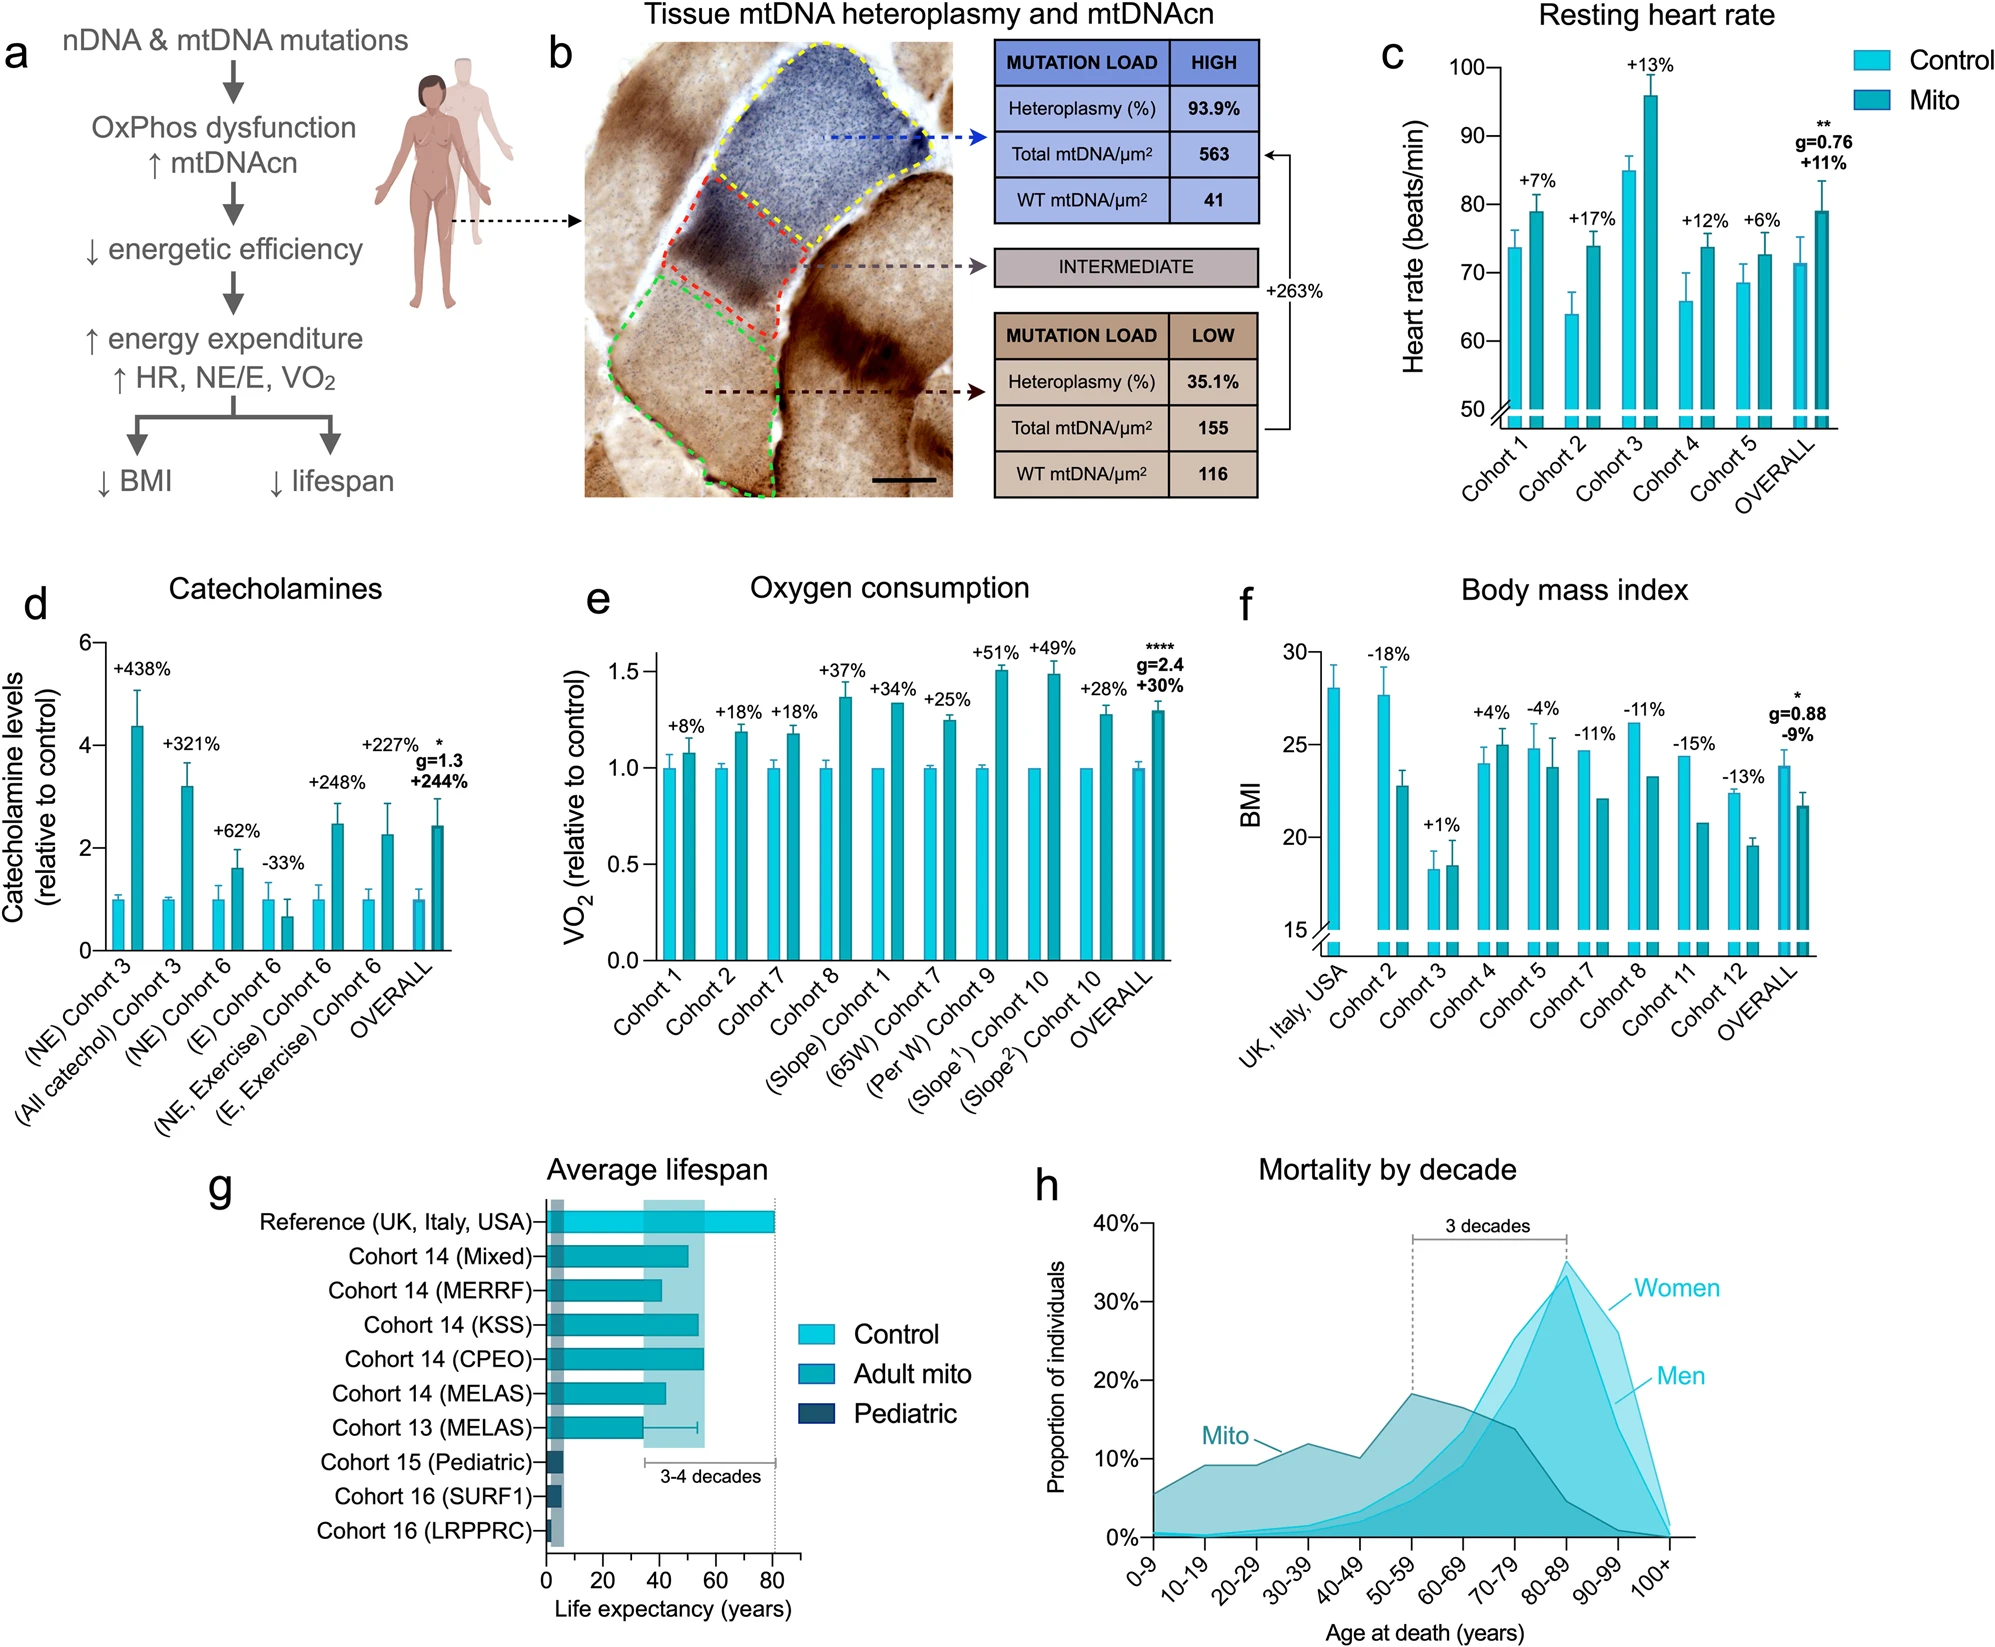
a Overall conceptual model linking mtDNA- and nDNA-related OxPhos defects to impaired metabolic efficiency at the cellular level, impacting whole-body resting energy expenditure and clinical outcomes. b Skeletal muscle biopsy with individual muscle fibers stained with cytochrome c oxidase/succinate dehydrogenase (COX/SDH) histochemistry to reveal functional (brown) and respiratory chain deficient (blue) mitochondria. In the affected cell (middle), three sub-regions showing low, intermediate, and high mtDNA mutation load were captured by laser capture microdissection and subjected to quantitative PCR analysis as in ref. 117. Subcellular regions with high mtDNA mutation load show elevated mtDNA density, which is predicted to increase the energetic cost due to mitochondrial biogenesis and turnover processes. WT, wild type. c Meta-analysis of human mitochondrial disease cohorts showing elevated resting heart rate (n = 104 controls, 111 patients), d catecholamines (urinary-Cohort 3 and blood-Cohort 6) at rest or during fixed-intensity exercise (n = 38 controls, 19 patients), e whole-body oxygen consumption measured by indirect calorimetry at rest or during the response to mild exercise challenge; one before training, two after training. Slope refers to the rate of increase in VO2 relative to work rate, where a higher slope indicates increased energetic cost for a given work rate (n = 56 controls, 78 patients). f Body mass index (BMI) across mitochondrial disease cohorts and compared to relevant national averages (USA, UK, and Italy combined) (n = 285 controls, 174 patients). g Average life expectancy in individuals with mitochondrial diseases relative to the national average (n = 301 patients). Data are means ± SEM, with % difference between mitochondrial disease and control group were available. h Mortality (age at death) over 10 years (2010–2020) in Cohort 17 compared to national averages for women and men (n = 109 patients). See Table 1 for cohort details. Total n = 225 healthy controls, 690 patients. Only aggregate group means (with or without a measure of variance) were available for some cohorts, so individual participant data is not shown. Standardized effect sizes are quantified as Hedges’ g (g). Overall group comparisons were performed by paired t tests (c and f) or one-sample t tests (d and e), *p < 0.05, **p < 0.01, ****p < 0.0001.
