
Fig. 1: Schematic diagram of the JUMPsem pipeline.
From: A computational tool to infer enzyme activity using post-translational modification profiling data
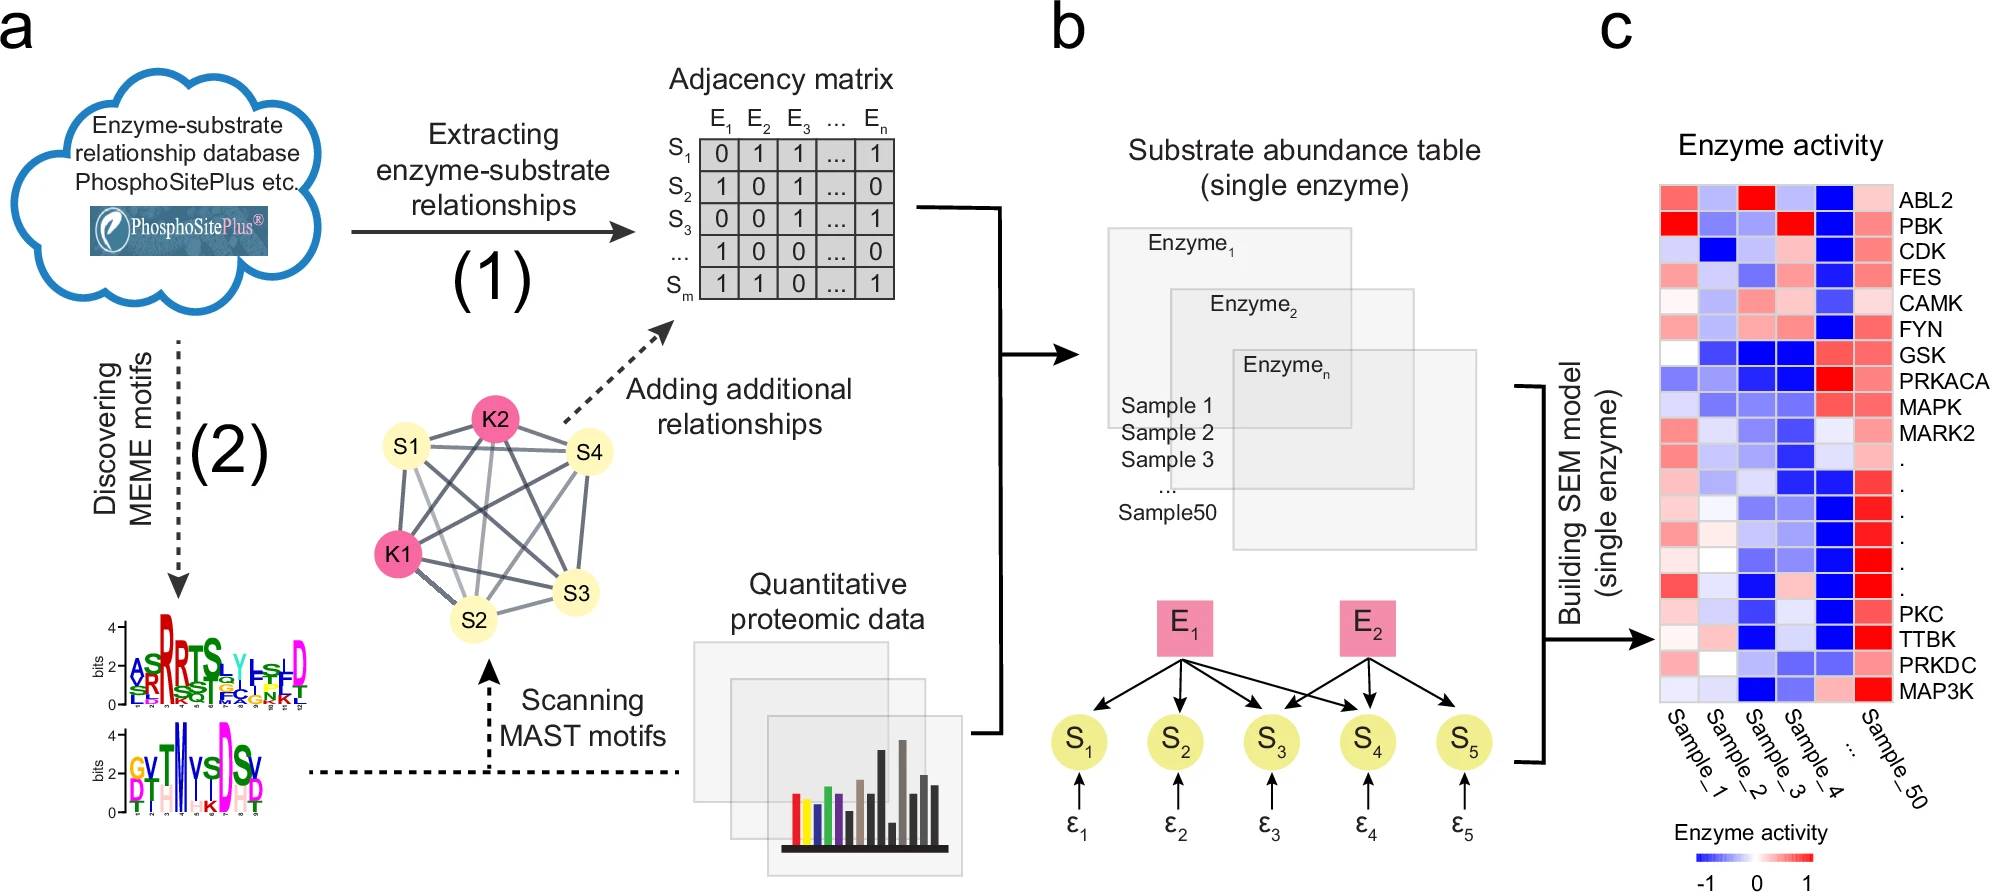
a Construction of enzyme-substrate relationships and discovery of novel enzyme-substrate relationships through motif search. Two approaches are employed: (1) generation of enzyme-substrate relationships from an existing database, indicated by solid lines in the diagram, and (2) motif searches to predict new enzyme-substrate interactions, denoted by dashed lines. The adjacency matrix and quantitative proteomic data are used to infer kinase activity. b Inferring enzyme activity using a structural equation modeling (SEM) algorithm. c The output of enzyme activities generated by the JUMPsem pipeline.
