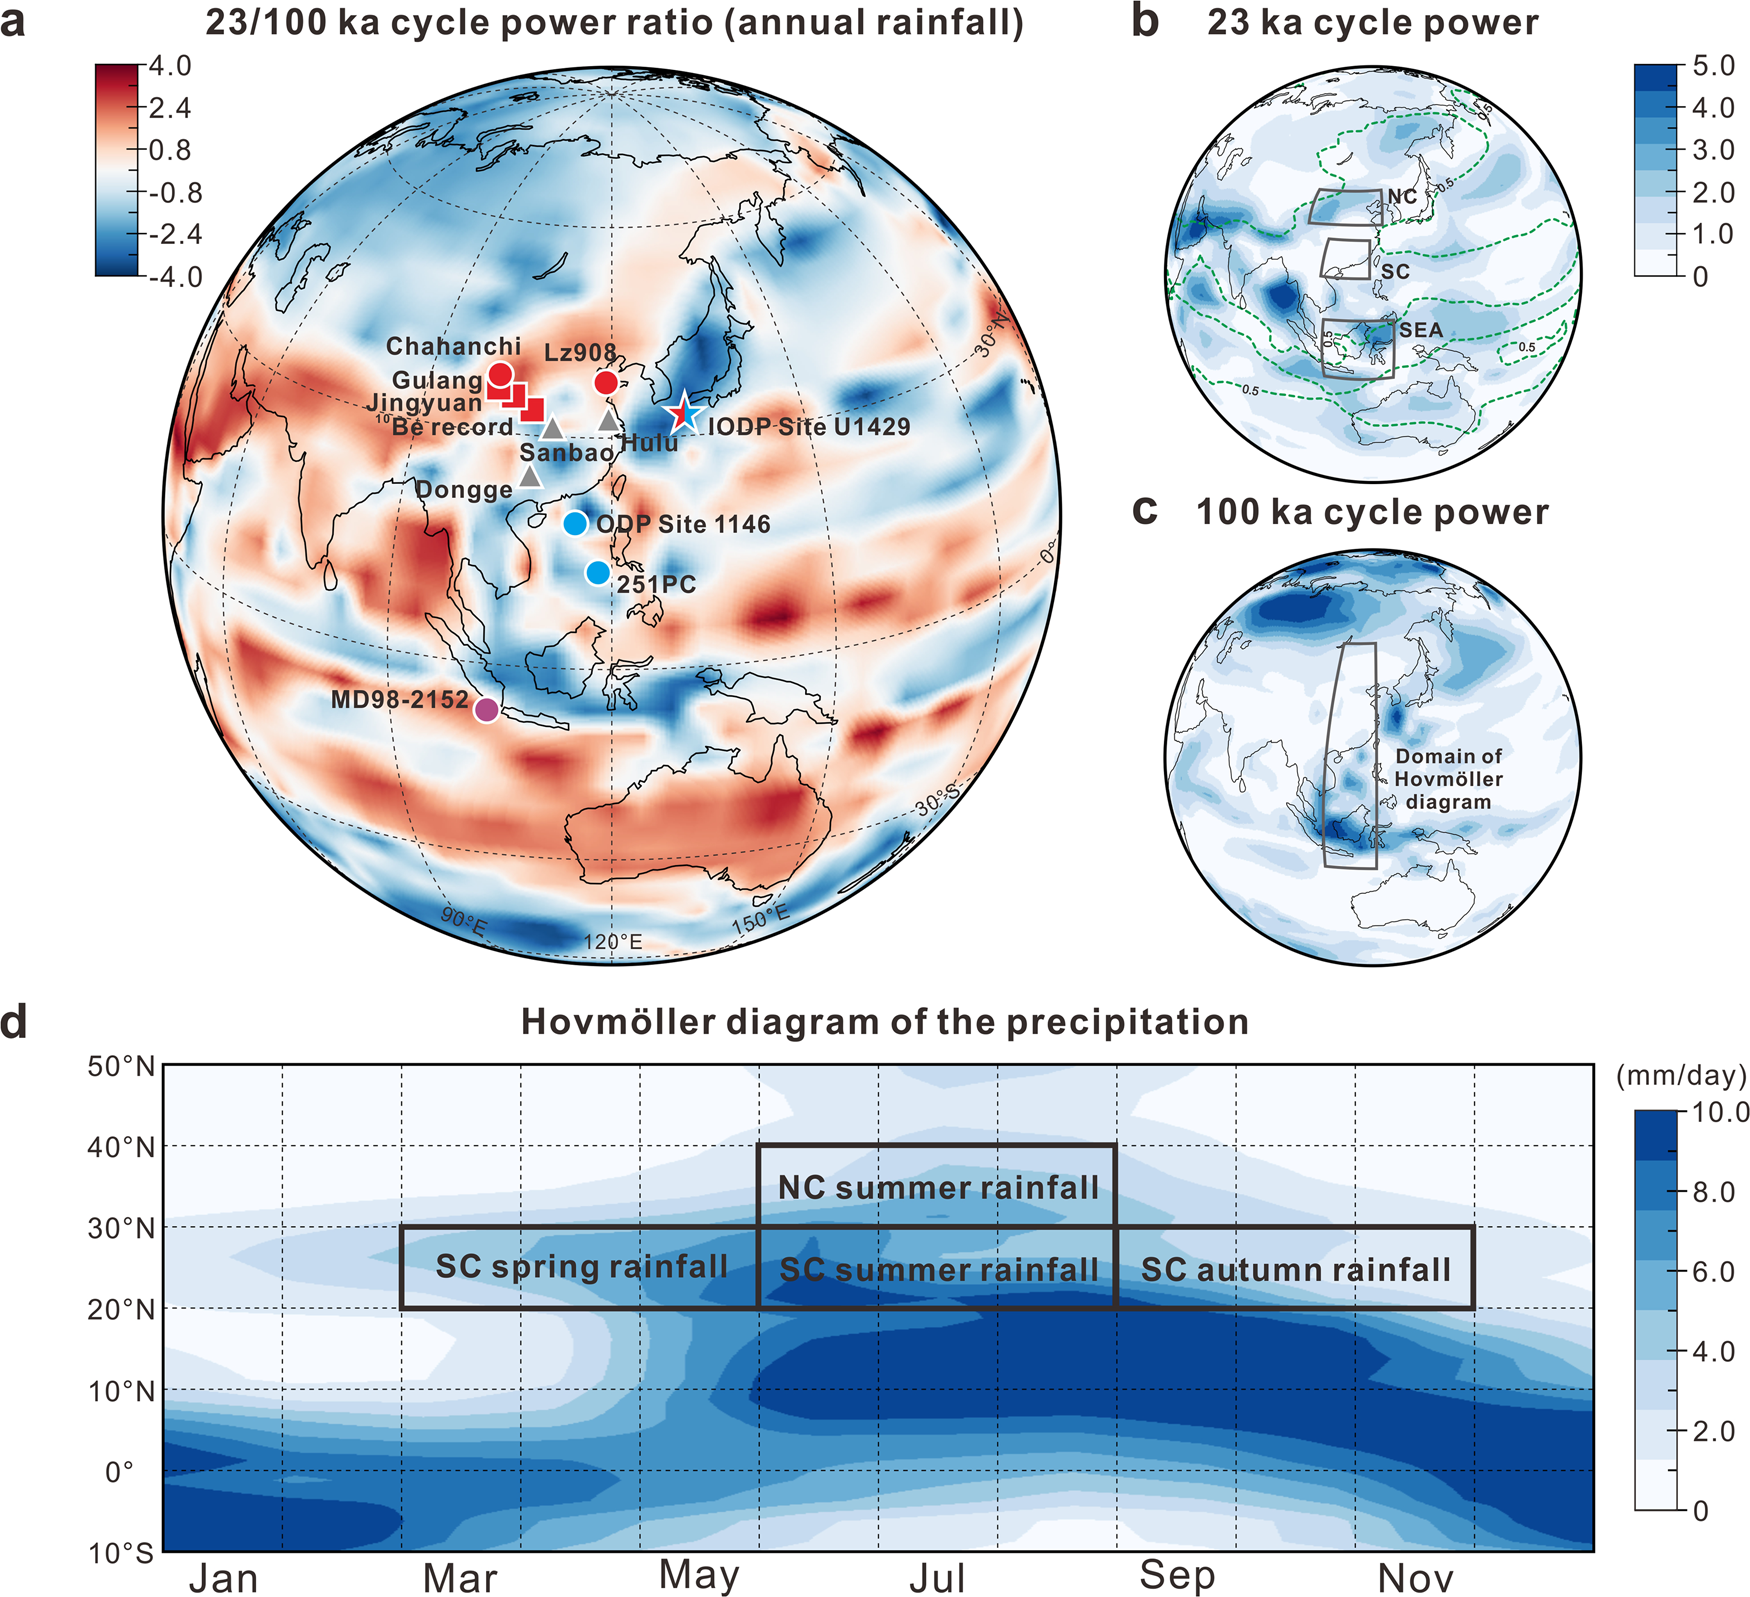
Fig. 1: Location of the study site and East-Southeast Asian hydroclimate cyclicity.

a Simulated cyclicity of the late Quaternary hydroclimate in East-Southeast Asia. Positive values indicate that the 23 ka cycle of annual rainfall variabilities (natural log ratio, unitless) was stronger than the 100 ka cycle. The star denotes IODP Site U1429 (this study); the northern China records have been shown in red, including Chinese loess sections collected in Gulang and Jingyuan9,39 and 10Be record37, sediment borehole of Chahanchi Lake in the Tengger Desert25 and coastal sediment core Lz908;42 the southern China records including ODP Site 114612 and 251PC53 have been shown in blue; the southeast Asian record of MD98-215217 has been shown in purple. Note that the half red and half blue in symbol of IODP Site U1429 has been used to indicate both northern China rainfall based on silicate weathering proxy (this study) and southern China rainfall based on seawater δ18O11 at this site. Besides, the grey triangles represent the locations of stalagmite records in China (Hulu, Sanbao and Dongge)44. b The 23 ka cycle power of annual rainfall with selected boxes exhibiting rainfall variation time series in northern China (NC, 33–43°N, 100–122°E), southern China (SC, 18–28°N, 105–120°E) and Southeast Asia (SEA, 10°S–8°N, 105–125°E). The green dashed line shows the simulated monsoon domains of the last 1000-year of the 300 ka simulation. The definition of monsoon domain follows86 where annual range of rainfall >1.5 mm/day. c The 100 ka cycle power of annual rainfall with selected boxes exhibiting a Hovmöller diagram (10°S–50°N, 105–120°E) of the precipitation climatology across East-Southeast Asia. The powers in b and c are estimated using the power spectrum of annual rainfall time series during the last 300 ka over each model gridcell, and are averaged over the 23 ka and 100 ka period band, respectively. d A Hovmöller diagram of the precipitation climatology across East-Southeast Asia. The timings of the spring, summer and autumn rainfall stages in northern and southern China are also shown, suggesting the annual rainfall in northern China largely fell during the summer months, but in southern China largely occurs during the spring, summer and autumn months. In the figure, the Climate Prediction Center (CPC) Merged Analysis of Precipitation (CMAP) dataset spanning 1981 to 2010 provided by the NOAA/OAR/ESRL PSL was used.
