
Fig. 4: Model performance in label prediction.
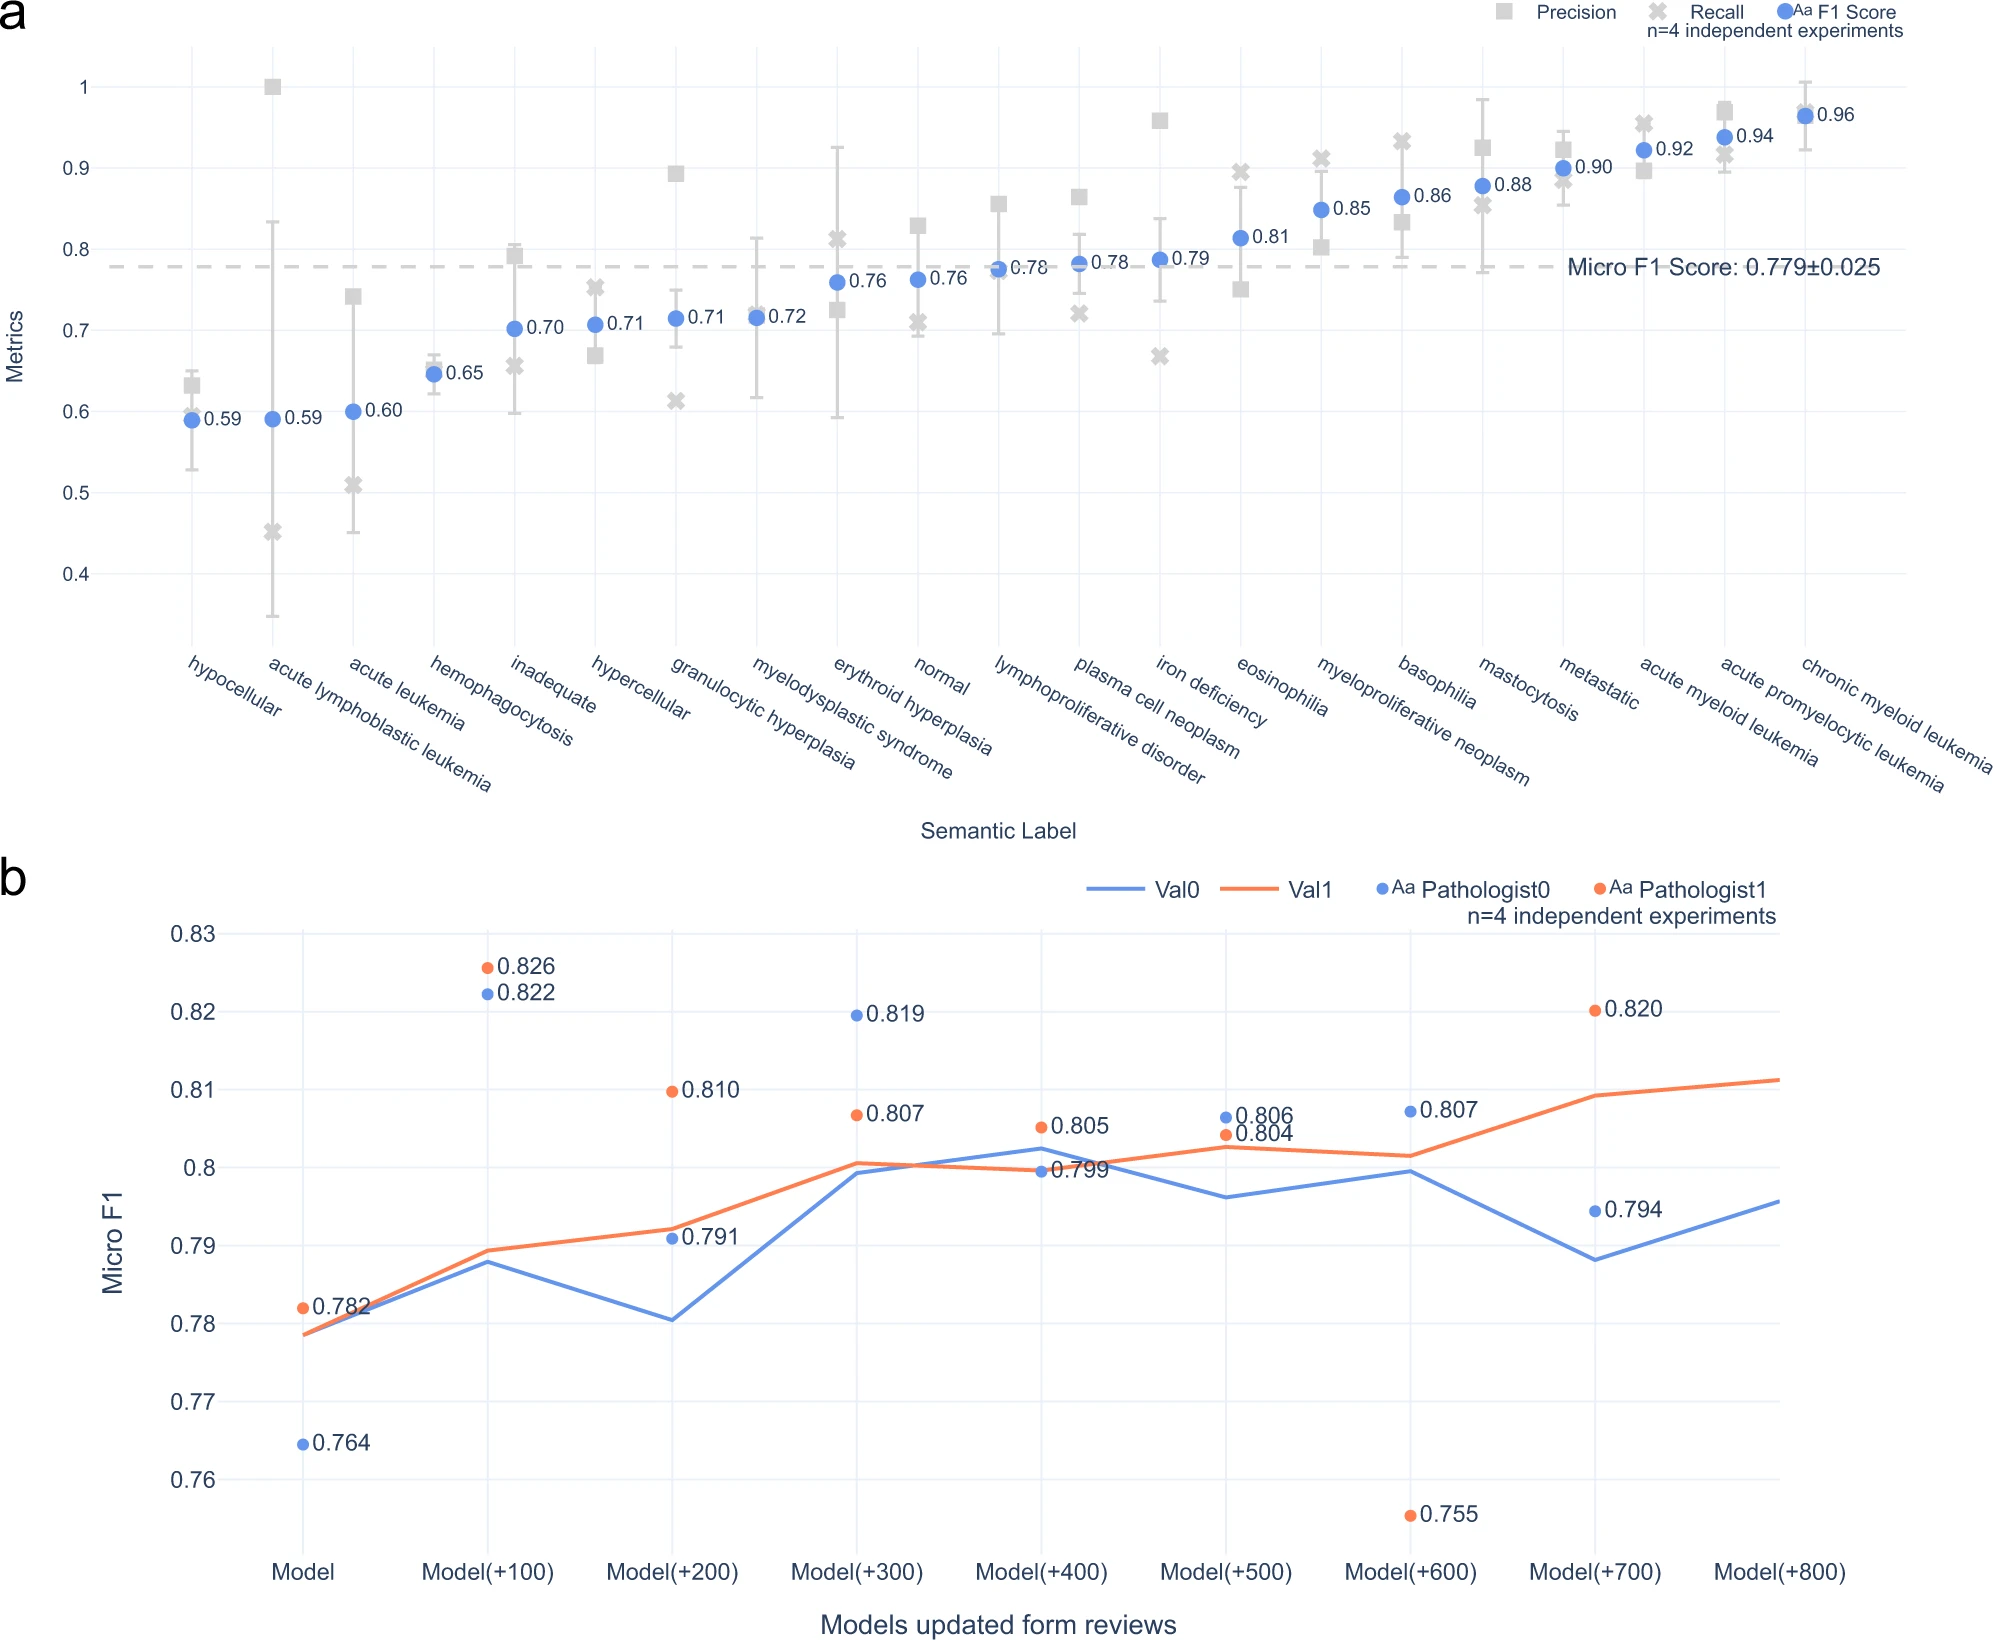
a The mean F1 scores and the standard deviation computed across four validation experiments for each label from the final models are shown. Our training strategy was to treat all labels independently. On average, the micro-average F1 score is 0.779 (Supplementary Table S2). Interestingly, the label “acute lymphoblastic leukemia” and “acute leukemia” has the lowest F1 score (0.59 and 0.60), though its sample size in the dataset is similar to that of “acute promyelocytic leukemia” (0.94). This may imply the performance is not determined solely by data size; other factors also play an important role. b Marginal improvement with expert feedback on randomly selected cases is shown. Pathologists reviewed the model’s predictions in 8 batches (100 randomly selected cases per batch, 800 cases in total). For each batch, the newly reviewed cases were added to the training set to re-train the model, and the updated model was used to make the next batch’s predictions (Supplementary Fig. S6). Dots represent each model generation’s performance as judged by the hematopathologists. When tested against the validation set (lines), the model started at the micro-average F1 score of 0.779. With more labeled cases provided, the model’s performance improves slightly to reach a maximum of 0.811, which shows that more cases only provide marginal improvement when randomly selected (i.e., not enriched for rare labels by active learning). We used the feedback to simulate this experiment on another three models. The values here are the average of the results from the four experiments.
