
Fig. 5: Co-occurrence of the predicted labels.
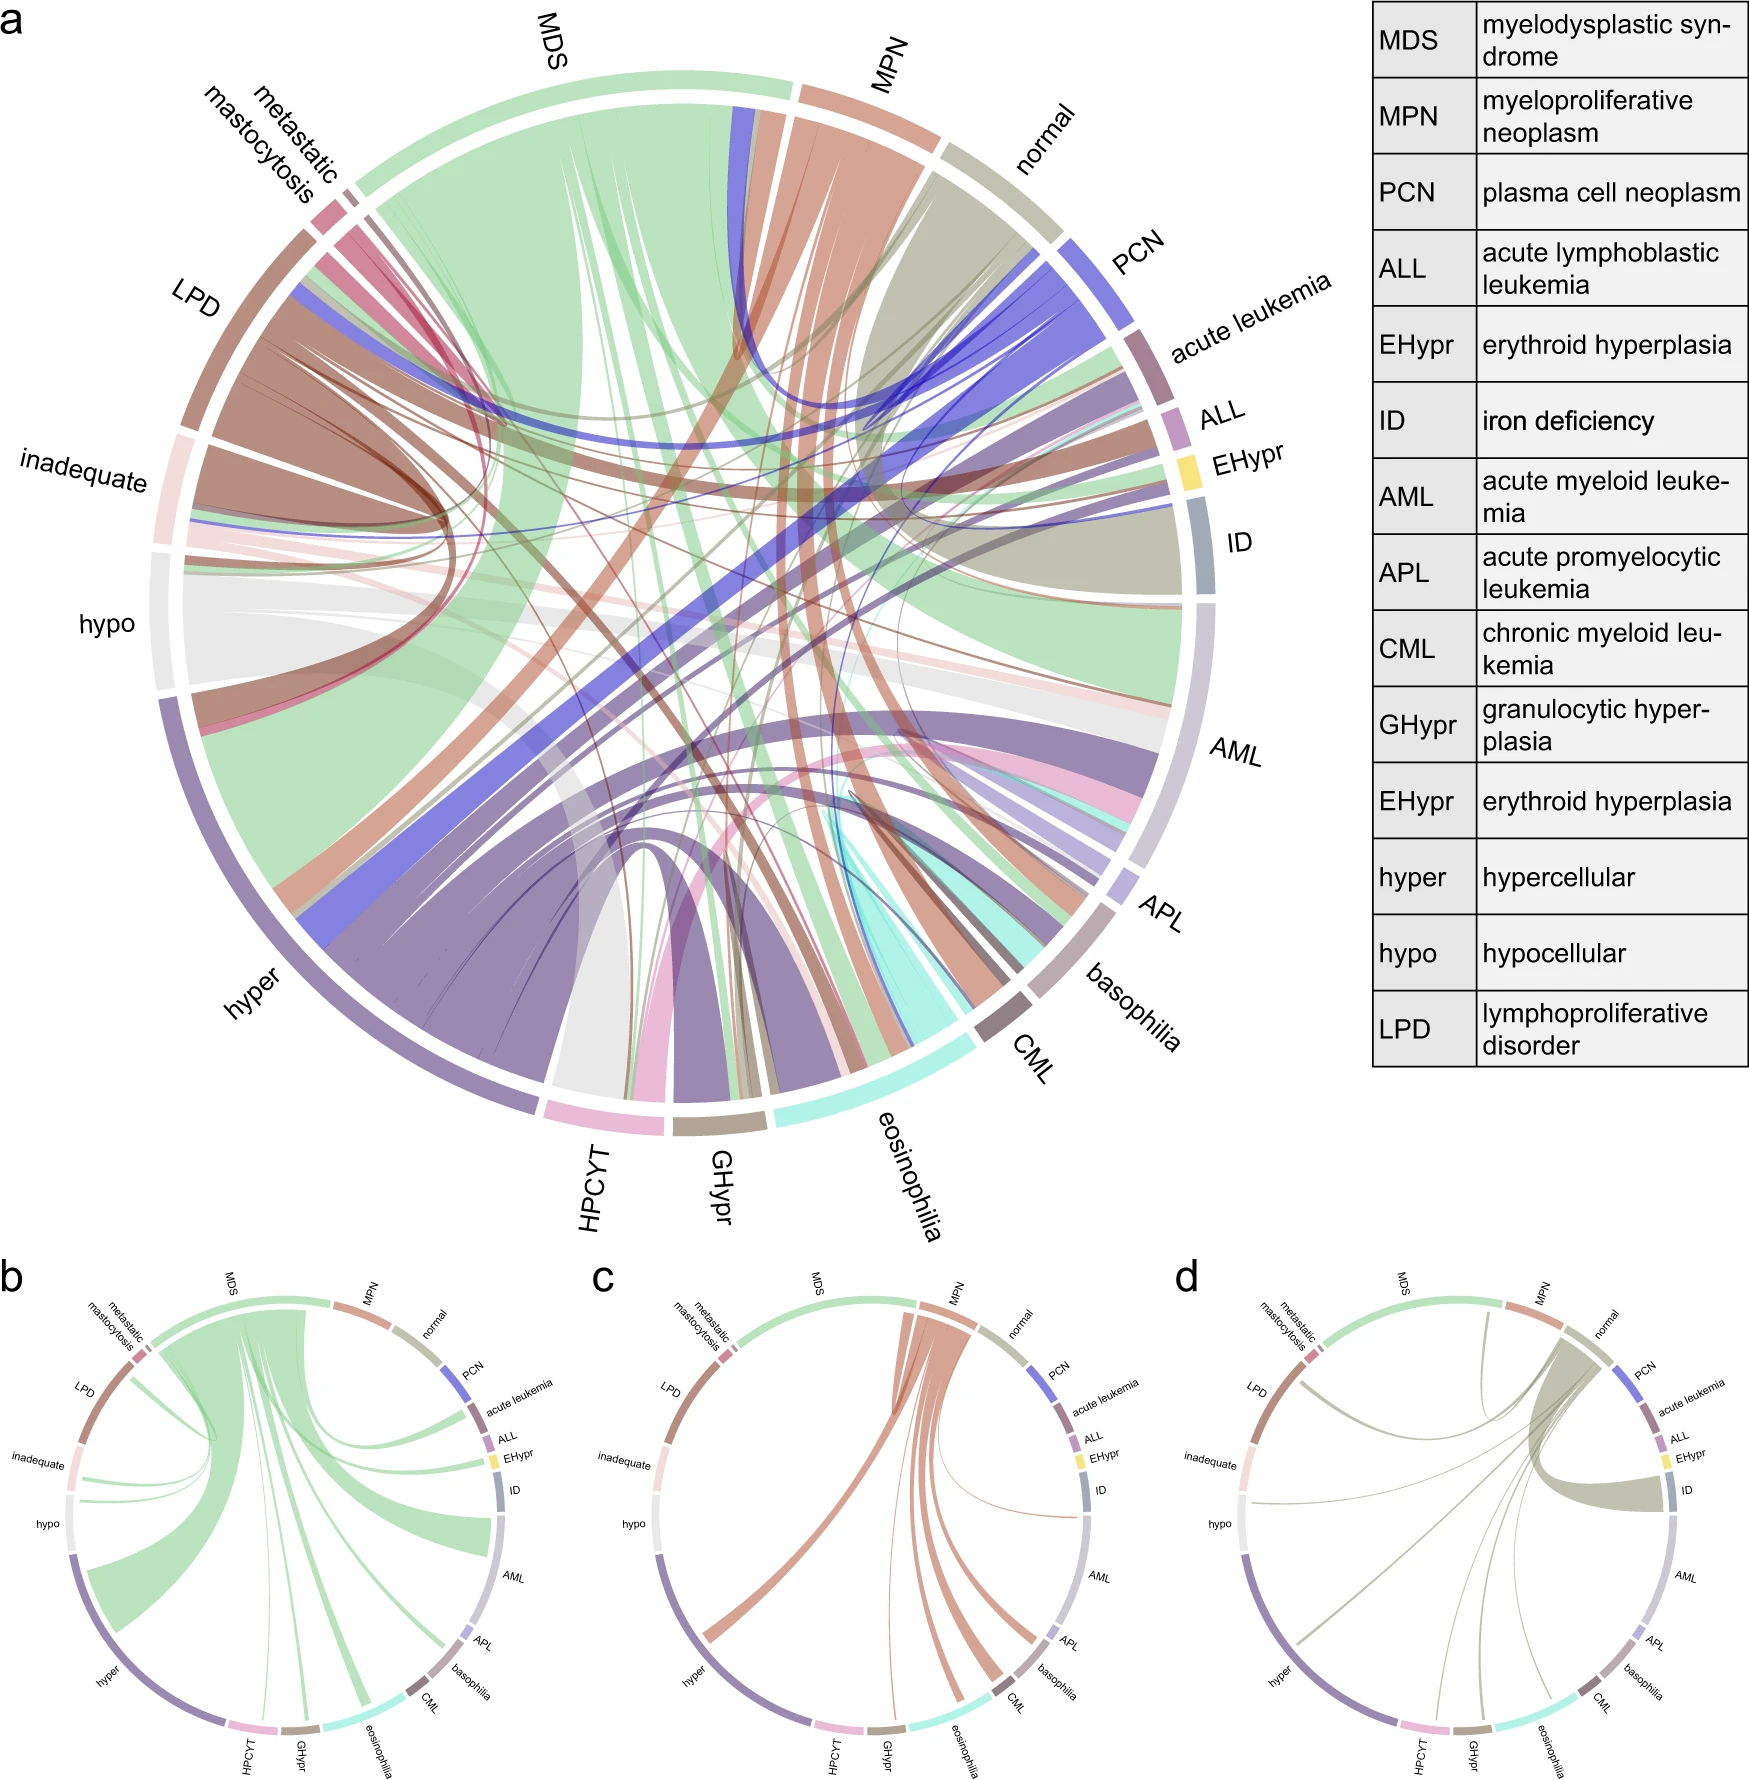
a The chord diagram of the model predicted labels among 1000 samples is shown. Most co-occurrence relationships match semantic word relationships in hematopathology. However, the model does not learn the exclusiveness of the label "normal''. It may be because we treated labels independently during model training. b The label “myelodysplastic syndrome” co-occurred often with the labels “acute myeloid leukemia” and “hypercellular”. c The label “myeloproliferative neoplasm” tended to co-occur with the labels “chronic myeloid leukemia”, “hypercellular”, “basophilia”, and “eosinophilia”. d The model does not learn the exclusiveness of the label “normal”. [An interactive web version can be accessed via https://storage.googleapis.com/pathopatho/chord.html]
