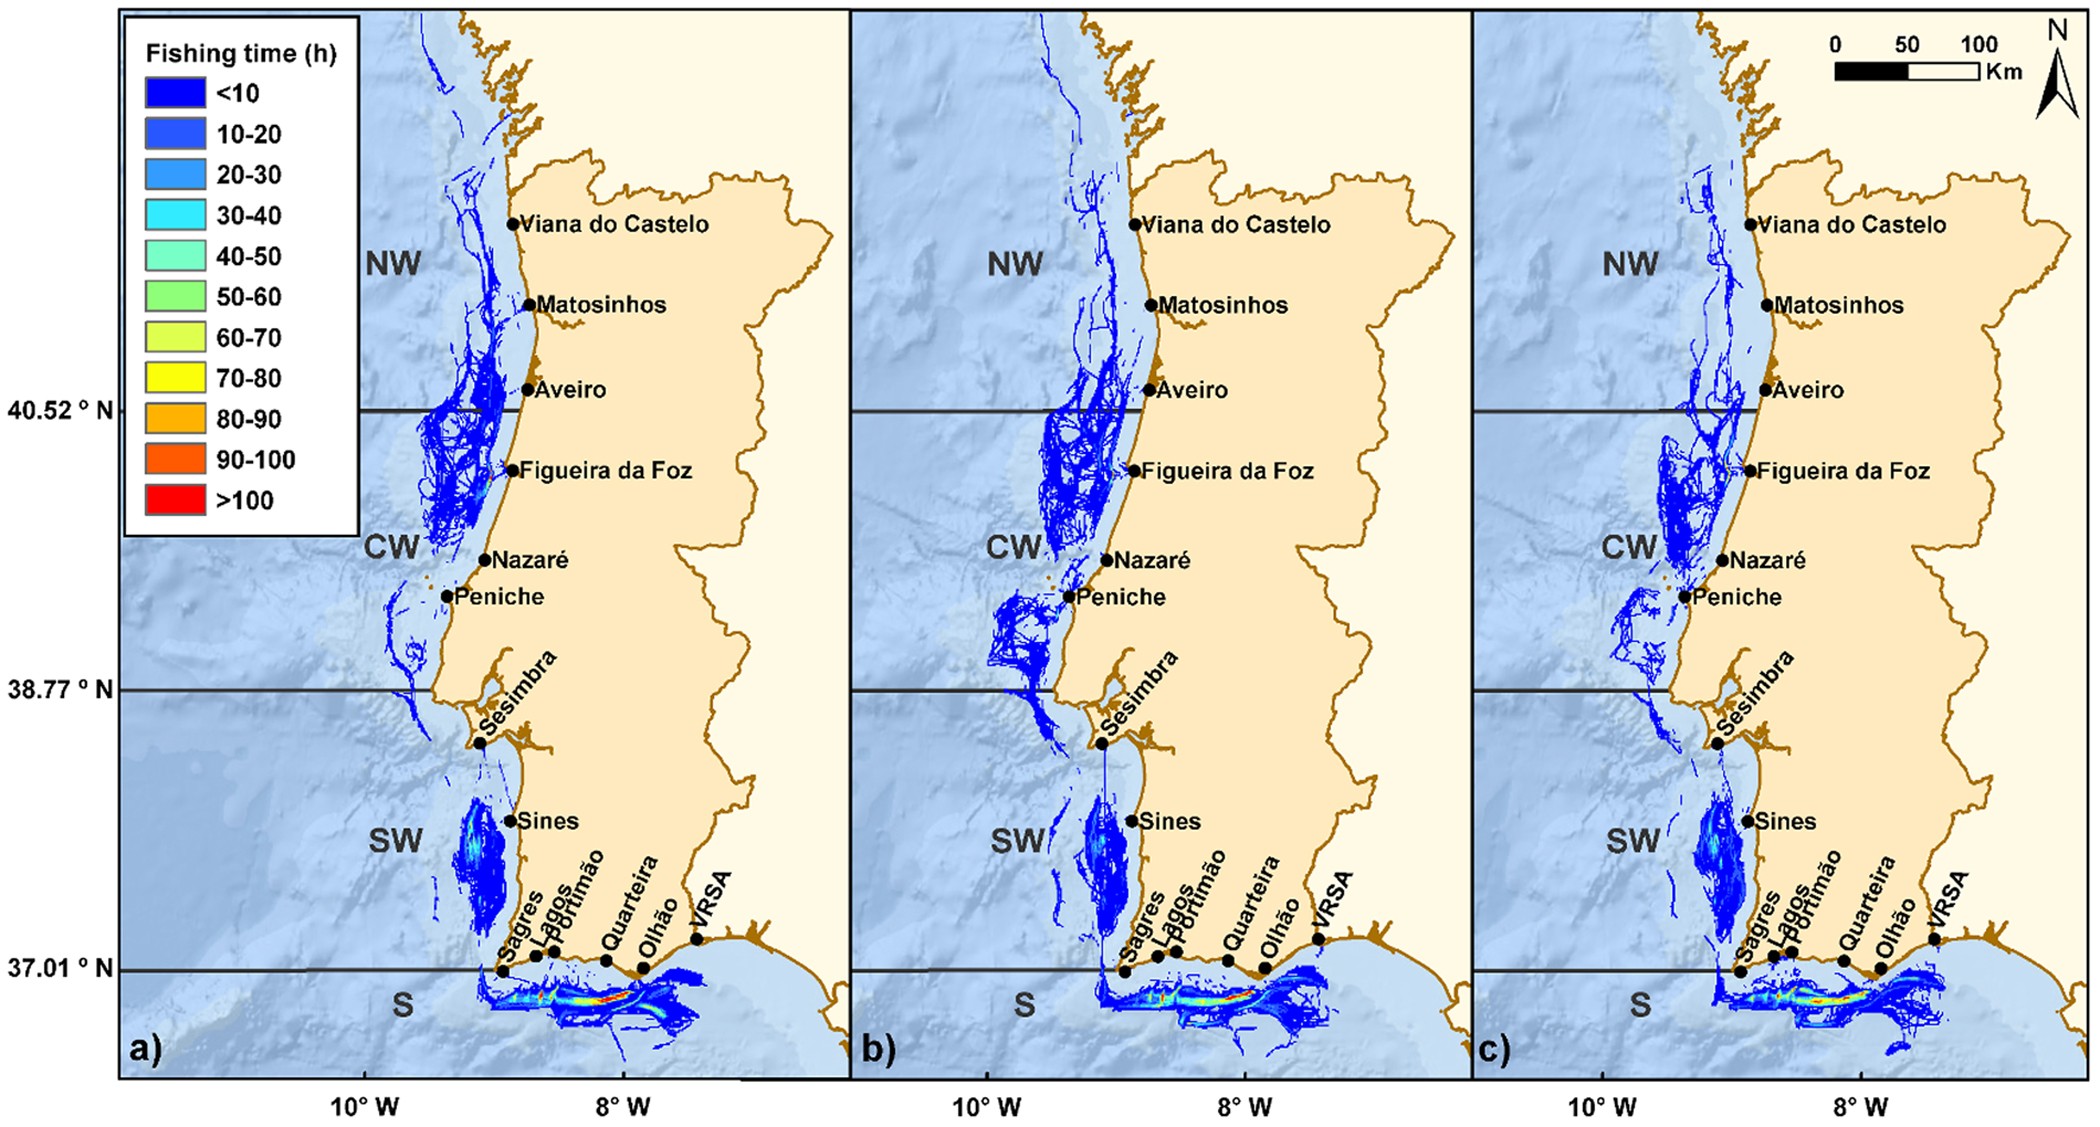
Figure 1

Trawling effort distribution by the whole crustacean trawling fleet in Portuguese waters during (a) 2012 (69596 h y−1), (b) 2013 (66766 h y−1), and (c) 2014 (63427 h y−1). Coordinates system used: WGS 1984 UTM Zone 29 N. Service Layer Credits: General Bathymetric Chart of the Oceans (GEBCO). Map created using ArcGIS v.10.2, https://www.arcgis.com/.
