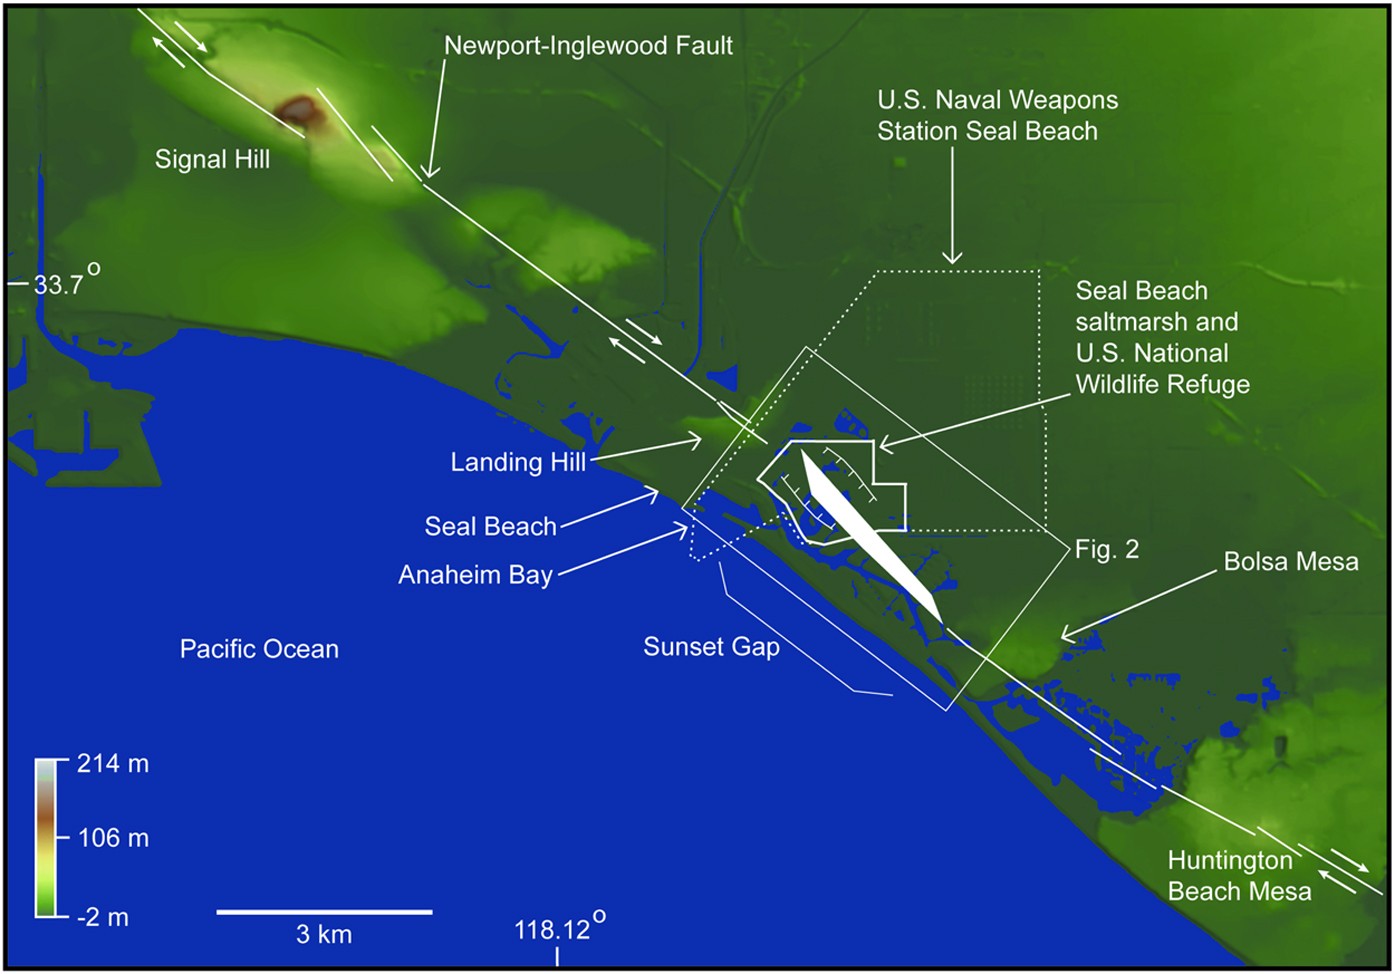
Figure 1: National Elevation Dataset (10 m) base map showing structural complexity and geographic points of interest along the Newport-Inglewood fault.
From: Evidence for coseismic subsidence events in a southern California coastal saltmarsh

Small white arrows along the fault show sense of movement. Fault traces are from State of California Special Studies Zones Seal Beach Quadrangle, 198660. White polygon illustrates right step in trace of fault and white lines with inward hatches indicate zone and pattern of subsidence. Topographic data was obtained from the U.S. Geological Survey National Elevation Dataset, 1/3 arc second data via The National Map Viewer61, modeled using QT Modeler v.8.0 and modified in Adobe Illustrator CC v.20.1.0.
