
Abstract
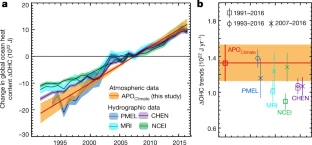
The ocean is the main source of thermal inertia in the climate system1. During recent decades, ocean heat uptake has been quantified by using hydrographic temperature measurements and data from the Argo float program, which expanded its coverage after 20072,3. However, these estimates all use the same imperfect ocean dataset and share additional uncertainties resulting from sparse coverage, especially before 20074,5. Here we provide an independent estimate by using measurements of atmospheric oxygen (O2) and carbon dioxide (CO2)—levels of which increase as the ocean warms and releases gases—as a whole-ocean thermometer. We show that the ocean gained 1.33 ± 0.20 × 10²² joules of heat per year between 1991 and 2016, equivalent to a planetary energy imbalance of 0.83 ± 0.11 watts per square metre of Earth’s surface. We also find that the ocean-warming effect that led to the outgassing of O2 and CO2 can be isolated from the direct effects of anthropogenic emissions and CO2 sinks. Our result—which relies on high-precision O2 measurements dating back to 19916—suggests that ocean warming is at the high end of previous estimates, with implications for policy-relevant measurements of the Earth response to climate change, such as climate sensitivity to greenhouse gases7 and the thermal component of sea-level rise8.
This is a preview of subscription content, access via your institution
Access options
Access Nature and 54 other Nature Portfolio journals
Get Nature+, our best-value online-access subscription
$32.99 / 30 days
cancel any time
Subscribe to this journal
Receive 51 print issues and online access
$199.00 per year
only $3.90 per issue
Buy this article
- Purchase on SpringerLink
- Instant access to the full article PDF.
USD 39.95
Prices may be subject to local taxes which are calculated during checkout


Data availability
Scripps APO data are available at http://scrippso2.ucsd.edu/apo-data. APOClimate data, contributions to APOOBS and ocean heat content time series are available in Extended Data Figs. 1–4 and Extended Data Tables 1–5. Model results are available upon reasonable request to R.W. (IPSL anthropogenic aerosol simulations), L.B. (IPSL-CM5A-LR), M.C.L. (CESM-LE), J.P.D. (GFDL-ESM2M) or W.K. (UVic).
Change history
19 November 2018
Editor’s Note: We would like to alert readers that the authors have informed us of errors in the paper. An implication of the errors is that the uncertainties in ocean heat content are substantially underestimated. We are working with the authors to establish the quantitative impact of the errors on the published results, at which point in time we will provide a further update.
25 September 2019
This Article has been retracted; see accompanying Retraction Note.
References
IPCC. Climate Change 2013: The Physical Science Basis (eds Stocker, T. F. et al.) (Cambridge Univ. Press, Cambridge, 2013).
Abraham, J. P. et al. A review of global ocean temperature observations: implications for ocean heat content estimates and climate change. Rev. Geophys. 51, 450–483 (2013).
Riser, S. C. et al. Fifteen years of ocean observations with the global Argo array. Nat. Clim. Chang e 6, 145–153 (2016).
Boyer, T. et al. Sensitivity of global upper-ocean heat content estimates to mapping methods, XBT bias corrections, and baseline climatologies. J. Clim. 29, 4817–4842 (2016).
Cheng, L. et al. XBT science: assessment of instrumental biases and errors. Bull. Am. Meteorol. Soc. 97, 924–933 (2016).
Keeling, R. F. & Manning, A. C. in Treatise on Geochemistry 385–404 (Elsevier, Oxford, 2014).
Forster, P. M. Inference of climate sensitivity from analysis of Earth’s energy budget. Annu. Rev. Earth Planet. Sci. 44, 85–106 (2016).
Church, J. A. et al. in Climate Change 2013: The Physical Science Basis (eds Stocker, T. F. et al.) 1137–1216 (IPCC, Cambridge Univ. Press, Cambridge, 2013).
Ishii, M. et al. Accuracy of global upper ocean heat content estimation expected from present observational data sets. Sci. Online Lett. Atmos. 13, 163–167 (2017).
Johnson, G. C. et al. Ocean heat content. Am. Meteorol. Soc. Bull. 98, S66–S68 (2017).
Desbruyères, D. G., Purkey, S. G., McDonagh, E. L., Johnson, G. C. & King, B. A. Deep and abyssal ocean warming from 35 years of repeat hydrography. Geophys. Res. Lett. 43, 10356–10365 (2016).
Cheng, L. et al. Improved estimates of ocean heat content from 1960 to 2015. Sci. Adv. 3, e1601545 (2017).
Allan, R. P. et al. Changes in global net radiative imbalance 1985–2012. Geophys. Res. Lett. 41, 5588–5597 (2014).
Palmer, M. D. Reconciling estimates of ocean heating and Earth’s radiation budget. Curr. Clim. Change Rep. 3, 78–86 (2017).
Loeb, N. G. et al. Observed changes in top-of-the-atmosphere radiation and upper-ocean heating consistent within uncertainty. Nat. Geosci. 5, 110–113 (2012).
Battle, M. et al. Measurements and models of the atmospheric Ar/N2 ratio. Geophys. Res. Lett. 30, 1786 (2003).
Ritz, S. P., Stocker, T. F. & Severinghaus, J. P. Noble gases as proxies of mean ocean temperature: sensitivity studies using a climate model of reduced complexity. Quat. Sci. Rev. 30, 3728–3741 (2011).
Resplandy, L. et al. Constraints on oceanic meridional heat transport from combined measurements of oxygen and carbon. Clim. Dyn. 47, 3335–3357 (2016); erratum 49, 4317 (2017).
Stephens, B. B. et al. Testing global ocean carbon cycle models using measurements of atmospheric O2 and CO2 concentration. Glob. Biogeochem. Cycles 12, 213–230 (1998).
Le Quéré, C. et al. Global carbon budget 2016. Earth Syst. Sci. Data 8, 605–649 (2016).
DeVries, T. The oceanic anthropogenic CO2 sink: storage, air-sea fluxes, and transports over the industrial era. Glob. Biogeochem. Cycles 28, 631–647 (2014).
Wang, R. et al. Influence of anthropogenic aerosol deposition on the relationship between oceanic productivity and warming. Geophys. Res. Lett. 42, 10745–10754 (2015).
Rietbroek, R., Brunnabend, S.-E., Kusche, J., Schröter, J. & Dahle, C. Revisiting the contemporary sea-level budget on global and regional scales. Proc. Natl Acad. Sci. USA 113, 1504–1509 (2016).
IPCC. Climate Change 2007: Synthesis Report (eds Core Writing Team, Pachauri, R. K. & Reisinger, A.) (IPCC, Geneva, 2008).
Keeling, R. F. & Severinghaus, J. P. in The Carbon Cycle (eds Wigley, T. M. L. & Schimel, D.) 134–140 (Cambridge Univ. Press, New York, 2000).
Resplandy, L., Séférian, R. & Bopp, L. Natural variability of CO2 and O2 fluxes: what can we learn from centuries-long climate models simulations? J. Geophys. Res. Oceans 120, 384–404 (2015).
Eddebbar, Y. A. et al. Impacts of ENSO on air-sea oxygen exchange: observations and mechanisms. Glob. Biogeochem. Cycles 31, 2017GB005630 (2017).
Keeling, R. F. & Garcia, H. E. The change in oceanic O2 inventory associated with recent global warming. Proc. Natl Acad. Sci. USA 99, 7848–7853 (2002).
Bopp, L., Le Quéré, C., Heimann, M., Manning, A. C. & Monfray, P. Climate-induced oceanic oxygen fluxes: implications for the contemporary carbon budget. Glob. Biogeochem. Cycles 16, 1022 (2002).
Keeling, C. D., Piper, S. C., Whorf, T. P. & Keeling, R. F. Evolution of natural and anthropogenic fluxes of atmospheric CO2 from 1957 to 2003. Tellus B Chem. Phys. Meterol. 63, 1–22 (2011).
Levitus, S. et al. World ocean heat content and thermosteric sea level change (0–2000 m), 1955–2010. Geophys. Res. Lett. 39, L10603 (2012).
Olsen, A. et al. The Global Ocean Data Analysis Project version 2 (GLODAPv2)—an internally consistent data product for the world ocean. Earth Syst. Sci. Data 8, 297–323 (2016).
Severinghaus, J. P. Studies of the Terrestrial O 2 and Carbon Cycles in Sand Dune Gases and in Biosphere. PhD Thesis, Columbia Univ. (1995).
Hamme, R. C. & Keeling, R. F. Ocean ventilation as a driver of interannual variability in atmospheric potential oxygen. Tellus B Chem. Phys. Meterol. 60, 706–717 (2008).
Andres, R. J., Boden, T. A. & Higdon, D. A new evaluation of the uncertainty associated with CDIAC estimates of fossil fuel carbon dioxide emission. Tellus B Chem. Phys. Meterol. 66, 23616 (2014).
Keeling, R. F., Manning, A. C., Paplawsky, W. J. & Cox, A. C. On the long-term stability of reference gases for atmospheric O2/N2 and CO2 measurements. Tellus B Chem. Phys. Meterol. 59, 3–14 (2007).
Ballantyne, A. P. et al. Audit of the global carbon budget: estimate errors and their impact on uptake uncertainty. Biogeosciences 12, 2565–2584 (2015).
Bronselaer, B., Winton, M., Russell, J., Sabine, C. L. & Khatiwala, S. Agreement of CMIP5 simulated and observed ocean anthropogenic CO2 uptake. Geophys. Res. Lett. 44, 12298–12305 (2017).
Oeschger, H., Siegenthaler, U., Schotterer, U. & Gugelmann, A. A box diffusion model to study the carbon dioxide exchange in nature. Tellus 27, 168–192 (1975).
MacFarling Meure, C. et al. Law Dome CO2, CH4 and N2O ice core records extended to 2000 years BP. Geophys. Res. Lett. 33, L14810 (2006).
Wang, D., Gouhier, T. C., Menge, B. A. & Ganguly, A. R. Intensification and spatial homogenization of coastal upwelling under climate change. Nature 518, 390–394 (2015).
Ito, T., Nenes, A., Johnson, M. S., Meskhidze, N. & Deutsch, C. Acceleration of oxygen decline in the tropical Pacific over the past decades by aerosol pollutants. Nat. Geosci. 9, 443–447 (2016).
Jickells, T. D. et al. A reevaluation of the magnitude and impacts of anthropogenic atmospheric nitrogen inputs on the ocean. Glob. Biogeochem. Cycles 31, 289–305 (2017).
Somes, C. J., Landolfi, A., Koeve, W. & Oschlies, A. Limited impact of atmospheric nitrogen deposition on marine productivity due to biogeochemical feedbacks in a global ocean model. Geophys. Res. Lett. 43, 4500–4509 (2016).
Aumont, O., Ethé, C., Tagliabue, A., Bopp, L. & Gehlen, M. PISCES-v2: an ocean biogeochemical model for carbon and ecosystem studies. Geosci. Model Dev. 8, 2465–2513 (2015).
Talley, L. D. et al. Changes in ocean heat, carbon content, and ventilation: a review of the first decade of GO-SHIP global repeat hydrography. Annu. Rev. Marine Sci. 8, 185–215 (2016).
Sarmiento, J. L. & Gruber, N. Sinks for anthropogenic carbon. Phys. Today 55, 30–36 (2002).
Garcia, H. E. & Gordon, L. I. Oxygen solubility in seawater: better fitting equations. Limnol. Oceanogr. 37, 1307–1312 (1992).
Gruber, N., Sarmiento, J. L. & Stocker, T. F. An improved method for detecting anthropogenic CO2 in the oceans. Glob. Biogeochem. Cycles 10, 809–837 (1996).
Dunne, J. P. et al. GFDL’s ESM2 global coupled climate–carbon Earth system models. Part I: physical formulation and baseline simulation characteristics. J. Clim. 25, 6646–6665 (2012).
Dunne, J. P. et al. GFDL’s ESM2 global coupled climate–carbon Earth system models. Part II: carbon system formulation and baseline simulation characteristics. J. Clim. 26, 2247–2267 (2013).
Séférian, R., Iudicone, D., Bopp, L., Roy, T. & Madec, G. Water mass analysis of effect of climate change on air–sea CO2 fluxes: the Southern Ocean. J. Clim. 25, 3894–3908 (2012).
Kay, J. E. et al. The Community Earth System Model (CESM) large ensemble project: a community resource for studying climate change in the presence of internal climate variability. Bull. Am. Meteorol. Soc. 96, 1333–1349 (2015).
Keller, D. P., Oschlies, A. & Eby, M. A new marine ecosystem model for the University of Victoria Earth System Climate Model. Geosci. Model Dev. 5, 1195–1220 (2012).
Bopp, L. et al. Multiple stressors of ocean ecosystems in the 21st century: projections with CMIP5 models. Biogeosciences 10, 6225–6245 (2013).
Keller, D. P., Kriest, I., Koeve, W. & Oschlies, A. Southern Ocean biological impacts on global ocean oxygen. Geophys. Res. Lett. 43, 6469–6477 (2016).
Long, M. C., Deutsch, C. & Ito, T. Finding forced trends in oceanic oxygen. Glob. Biogeochem. Cycles 30, 381–397 (2016).
Taylor, K. E., Stouffer, R. J. & Meehl, G. A. An overview of CMIP5 and the experiment design. Bull. Am. Meteorol. Soc. 93, 485–498 (2012).
Moore, J. K., Lindsay, K., Doney, S. C., Long, M. C. & Misumi, K. Marine ecosystem dynamics and biogeochemical cycling in the Community Earth System Model [CESM1(BGC)]: comparison of the 1990s with the 2090s under the RCP4.5 and RCP8.5 scenarios. J. Clim. 26, 9291–9312 (2013).
Rödenbeck, C., Le Quéré, C., Heimann, M. & Keeling, R. F. Interannual variability in oceanic biogeochemical processes inferred by inversion of atmospheric O2/N2 and CO2 data. Tellus B Chem. Phys. Meterol. 60, 685–705 (2008).
Hamme, R. C. Mechanisms controlling the global oceanic distribution of the inert gases argon, nitrogen and neon. Geophys. Res. Lett. 29, 35-1–35-4 (2002).
Trenberth, K. E., Fasullo, J. T., von Schuckmann, K. & Cheng, L. Insights into Earth’s energy imbalance from multiple sources. J. Clim. 29, 7495–7505 (2016).
WCRP Global Sea Level Budget Group. Global sea level budget 1993–present. Earth Syst. Sci. Data 10, 1551–1590 (2018).
Morice, C. P., Kennedy, J. J., Rayner, N. A. & Jones, P. D. Quantifying uncertainties in global and regional temperature change using an ensemble of observational estimates: the HadCRUT4 data set. J. Geophys. Res. Atmos. 117, D08101 (2012).
Hansen, J., Ruedy, R., Sato, M. & Lo, K. Global surface temperature change. Rev. Geophys. 48, RG4004 (2010).
Vose, R. S. et al. NOAA’s merged land–ocean surface temperature analysis. Bull. Am. Meteorol. Soc. 93, 1677–1685 (2012).
Keeling, R. F., Körtzinger, A. & Gruber, N. Ocean deoxygenation in a warming world. Annu. Rev. Mar. Sci. 2, 199–229 (2010).
Helm, K. P., Bindoff, N. L. & Church, J. A. Observed decreases in oxygen content of the global ocean. Geophys. Res. Lett. 38, L23602 (2011).
Ito, T., Minobe, S., Long, M. C. & Deutsch, C. Upper ocean O2 trends: 1958–2015. Geophys. Res. Lett. 44, 4214–4223 (2017).
Schmidtko, S., Stramma, L. & Visbeck, M. Decline in global oceanic oxygen content during the past five decades. Nature 542, 335–339 (2017).
Acknowledgements
We thank M. Winton for useful suggestions. L.R. acknowledges support from the Climate Program Office of the National Oceanic and Atmospheric Administration (NOAA), grant NA13OAR4310219, and from the Princeton Environmental Institute. The National Center for Atmospheric Research (NCAR) is sponsored by the National Science Foundation (NSF). We also thank the people who maintain the APO time series at Scripps and the groups developing the models CESM, GFDL, IPSL and UViC, used in this study. The Scripps O2 program has been supported by a series of grants from the US NSF and the NOAA, most recently 1304270 and NA15OAR4320071. Any opinions, findings, and conclusions or recommendations expressed in this material are those of the authors and do not necessarily reflect the views of the NSF and NOAA. We thank the staff at the Cape Grim Baseline Air Pollution Station of the Canadian Greenhouse Gas program for collection of air samples.
Reviewer information
Nature thanks L. Cheng, F. Primeau and the other anonymous reviewer(s) for their contribution to the peer review of this work.
Author information
Authors and Affiliations
Contributions
L.R. directed the analysis of the datasets and models used here and shared responsibility for writing the manuscript; R.F.K. shared responsibility for writing the manuscript; R.W. performed simulations of anthropogenic aerosols; L.B., J.P.D., M.C.L., W.K. and A.O. provided model results. All authors contributed to the final version of the manuscript.
Corresponding author
Ethics declarations
Competing interests
The authors declare no competing interests.
Additional information
Publisher’s note: Springer Nature remains neutral with regard to jurisdictional claims in published maps and institutional affiliations.
Extended data figures and tables
Extended Data Fig. 1 Effects of anthropogenic aerosols on APO.
a, Anomaly, relative to 1850 levels, in deposition of atmospheric anthropogenic aerosols (N, P and Fe) at the air–sea interface between 1960 and 2007, derived from model simulations with and without aerosols22. b, Impact of aerosol eutrophication on atmospheric O2 (solid lines) and CO2 (dashed lines) for all aerosols (black lines) and for each aerosol taken individually (coloured lines). c, Overall impact of aerosol eutrophication on ΔAPOClimate referenced to the first year that has observations (1991).
Extended Data Fig. 2 Solubility-driven changes in ocean oxygen and carbon concentrations.
a, Ocean observations of O2*, O2sat, Cpi* and Cpisat as a function of potential temperature in the Glodapv2 database32. b, OPOsat ( = O2sat + 1.1Cpisat, in grey) and the expected effects on APO owing to the combined effects of OPOsat and the thermal exchanges of N2 ( = O2sat + 1.1Cpisat – XO2 / XN2 [N2 – mean(N2)], in red). For clarity only 16 × 103 points randomly picked out of the 78,456 data points available are shown for each variable. Note that very low values of O2* (around 450 μmol kg−1) at low temperature (less than 10 °C) correspond to data collected in the Arctic Ocean, where phosphate concentrations (used for O2* calculation) are comparatively lower than in other cold ocean regions. Low O2* values in the Arctic explain the relatively low values of OPO shown in Extended Data Fig. 3a at temperatures below 10 °C.
Extended Data Fig. 3 Link between OPO, APOClimate and ocean heat.
a, c–f, OPO concentrations (yellow) and OPO concentrations at saturation based on O2 and CO2 solubility (OPOsat, grey) as a function of ocean temperature in the GLODAPv2 database32 (a) and four Earth-system models (IPSL, GFDL, CESM and UVic; c–f). Slopes give the OPO-to-temperature ratios in nmol J−1. b, The link between ΔAPOClimate and changes in ocean heat content (that is, ΔAPOClimate-to-ΔOHC ratio) in the four models is tied to their OPO-to-temperature ratios and can be constrained using the observed OPO-to-temperature of 4.45 nmol J−1 (vertical dashed lines). To avoid visual saturation, only 16,000 points, picked randomly, are shown for OPO.
Extended Data Fig. 4 Changes in APOClimate (ΔAPOClimate) and ocean heat content (ΔOHC) in four Earth-system models.
a, Simulated ΔAPOClimate (black outlines) are decomposed into the contributions (percentage of total) from changes in ocean thermal saturation (light blue) and biologically driven changes (dark blue), the latter including changes in photosynthesis/respiration and changes in ocean circulation that transport and mix gradients of biological origin. For each model, ΔAPOClimate is further decomposed into its O2, CO2 and N2 components—that is, how much of ΔAPOClimate is explained by changes in O2, CO2 and N2 air–sea fluxes due to ocean saturation changes and biologically driven changes. b, Model ΔAPOClimate-to-ΔOHC ratios over the 180 years of simulation (referenced to year 1991) in per meg per 1022 J units are: 0.85 ± 0.01 (CESM), 0.83 ± 0.01 (GFDL), 0.89 ± 0.03 (IPSL) and 0.99 ± 0.02 (UVic).
Source data
Rights and permissions
About this article

Cite this article
Resplandy, L., Keeling, R.F., Eddebbar, Y. et al. Quantification of ocean heat uptake from changes in atmospheric O2 and CO2 composition. Nature 563, 105–108 (2018). https://doi.org/10.1038/s41586-018-0651-8
Received:
Accepted:
Published:
Version of record:
Issue date:
DOI: https://doi.org/10.1038/s41586-018-0651-8
Keywords
This article is cited by
-
Transcriptomic Response of the Atlantic Surfclam (Spisula solidissima) to Acute Heat Stress
Marine Biotechnology (2024)
-
Evaluating the ability of macroalgae to create a chemical refuge for bivalves under ocean acidification conditions in closed-environment experiments
Journal of Applied Phycology (2024)
-
The opportunity costs of the politics of division and disinformation in the context of the twenty-first century security deficit
SN Social Sciences (2022)
-
Quantification of ocean heat uptake from changes in atmospheric O2 and CO2 composition
Scientific Reports (2019)

Nicholas Lewis
I have analysed the APO data in Extended Data Table 4 and
checked the paper's results. I found that the linear trend in the dAPO_Climate
data was 0.88 per meg per year, not 1.16 per meg per year as claimed. Moreover
the claimed uncertainty in this trend was far smaller than what I calculate
using the data error distributions. As the paper's ocean heat uptake rate is
derived by applying a conversion factor to its dAPO_Climate trend, this means
that all of the paper's findings are wrong.
I raised these issues with Laure Resplandy on 1 November,
but to date I have received no response other than that they are looking into
the issues I raised. In order to correct without further delay mistaken
impressions arising from erroneous claims made in the Resplandy et al. paper, I
have now published a detailed article explaining the nature of the errors in
the Resplandy et al paper, at https://judithcurry.com/201...
WHUT Replied to Nicholas Lewis
Nicholas Lewis : When you say "that all of the paper's findings are wrong", are you neglecting to consider that this paper is describing an independent means of estimating ocean heat uptake, and which largely agrees with previous estimates?
Hop Lite Replied to WHUT
Actually, the paper was deemed newsworthy because it disagreed with previous estimates and was estimating higher heat uptake. With Nic's corrections it now agrees with previous estimates but with much higher uncertainty.
David Appell Replied to Hop Lite
Lewis's corrections won't matter unless they're submitted to Nature and Resplandy et al have a chance to respond (there). That's how science works; blog posts aren't science.
Hop Lite Replied to David Appell
I presume he is going to submit a response to Nature. He has already done so to Resplandy directly. His current 'publication' online is a form of online peer review of his work which I suspect is far more effective than what the traditional peer review process has become in a highly politicised field.
David Appell Replied to Hop Lite
There is no "online peer review." Peer review is done by experts, not by blog readers who are mostly uninformed deniers.
Argyn Kuketayev Replied to David Appell
https://www.washingtonpost....
David Appell Replied to Argyn Kuketayev
Your link certainly does not invalidate my claim.
Argyn Kuketayev Replied to David Appell
"blog posts aren't science" - this is wrong. Nature is owned by McMillan Publishers which is owned by Holtzbrinck Publishing Group, a privately held for profit enterprise. Since when this is The Way to communicate scientific advancements? In old days this was done through private communications between scientists, in letters, conferences. The fact that somehow after WWII we reduced all communication to paid journals is an aberration. Arxiv is a great example. For instance, almost all new stuff in AI/ML is published through arxiv instead of paid journals. Climate science needs to adapt the same approach. Only then it will have a chance to clean itself of politics.
ralphie_the_buffalo Replied to Argyn Kuketayev
Yeah and so-called "Science" published in Nature ain't necessarily right or anywhere close to it. See Ioannidis, most published "research" is wrong
David Appell Replied to Argyn Kuketayev
Have you ever done any science?
If so, you will understand that science is not written up in an hour and unleashed on the Web.
Argyn Kuketayev Replied to David Appell
Now the authors are correcting underestimated uncertainties. After all a blog corrected "science."
MuscleBustedLabia Replied to David Appell
Careful there guy your bias is showing up. Especially when all the outlets are talking about the "misinformed" experts. Whoops...a math mistake. What climate scientists don't have their work checked by mathematicians or are they wizards of science now?
David Appell Replied to MuscleBustedLabia
Mathematicians who don't understand the physics would be of no use here.
The paper was corrected in 15 days. What better do you want?
MuscleBustedLabia Replied to David Appell
Oh I dunno......maybe some of the more alarmist predictions to not turn out wrong so often....and when new alarmist predictions come out that they at least have their worked checked independently before its gets published in a way that the rabid on both sides can shove or dismiss at will.
It's not like this is a really hot button issue right now that is a pretty accurate reflection of politics...so what's the harm in pushing out some alarmist predictions everyone starts running with only to have the opposition discover a math error and then exploit it to his benefit?
David Appell Replied to MuscleBustedLabia
Which predictions have been wrong? Wallace Broecker was very close. So was Hansen.
David L. Hagen Replied to David Appell
DavidAppell Re "how science works". Incorrect. When rejected by U of Piza's Aristotelian Academicians Galileo published his results in Italian providing them directly to the public rather than in scholarly Latin. Noble Laureate Richard Feynman details the high standard of scientific method, emphasizing the need to detail ALL facts that disagree and ALL differing models - regardless of source or publication. Try rising to that standard of science. See: http://calteches.library.ca...
David Appell Replied to David L. Hagen
Sciences rises to that standard innumerable times every day. That hardly means it's perfect. The Resplany et al paper went from publication to corrections in 15 days. What do you think is wrong with that?
David Appell Replied to David L. Hagen
"Nic Lewis Owes Resplandy et al an Apology," 11/15/18
https://davidappell.blogspo...
David L. Hagen Replied to Nicholas Lewis
Nic Lewis showed Resplandy et al. nominally had a 373% error in the uncertainty estimates. Compare "irreducible minimum ΔAPOClimate trend uncertainty" = "± 0.56 per meg yr−1" vs "Resplandy et al.’s ± 0.15 ΔAPOClimate trend uncertainty estimate is completely infeasible".
Furthermore, Type B ("systematic" etc) errors can often be as large or larger than Type A ("statistical") errors.
When will there be a detailed uncertainty analysis and comparison of Argo resistive vs O2-CO2 composition temperatures vs global climate Models (GCM) predictions following BIPM's international standard: "Evaluation of measurement data — Guide to the expression of uncertainty in measurement " JCGM 100:2008? https://bit.ly/2Q0tqQv https://www.bipm.org/utils/...
Daniel Woodard
Mr. Lewis, please identify the exact quote in the paper you are disputing. I do not see it. The conclusion of the paper is that changes in the solubility of oxygen and carbon dioxide in the oceans serve as an indication of average ocean temperature and can thus be used to fill in the data from past decades when physical monitoring data is scarce.
Nicholas Lewis Replied to Daniel Woodard
That's easy. On page 1:
"From equation (1), we thereby find that ΔAPOClimate = 23.20 ± 12.20 per meg, corresponding to a leastsquares linear trend of +1.16 ± 0.15 per meg per year"
and in the Methods section:
"We find a ΔAPOClimate trend of 1.16 ± 0.15 per meg yr−1 for 1991–2016."
Norman Rogers
I don't understand how deep ocean water can outgas as it warms. Where does the gas go? Second, water in the deep ocean comes from the sinking side of the overturning circulation. As the water sinks near the poles the pressure greatly increases, increasing the solubility of gas greatly. Thus it seems to me that even if the water warms the gas will stay in solution due to the pressure. I would think that the water in the ocean will not outgas unless it comes quite near the surface. In other words the entire theory seems wrong to me and would only give the correct result if one waited a long time (thousands of years) for the ocean gas content to come into equlibrium with the atmosphere. What am I missing?
Laure Resplandy
We are preparing corrections, as described on RealClimate: http://www.realclimate.org/...
B1663r Replied to Laure Resplandy
It appears the corrections failed?
Martin Catchpole Replied to B1663r
Indeed! https://www.nature.com/arti...
joe306tow
I love how you folks drag your feet, when you screw up! When is the Rest of the GEO/;Political JUNK SCIENCE fans going to Report on This HUGE screw up?: I doubt they will ever admit to it. It harms you're huge Shell Game called Climate Change. And that is ALL of this is. A Giant Shell Game to get the USA and Americans to pay for Cleaning up the entire Planet. Nope! Not happening. If this were truly REAL, why would you give China, India, Pakistan and others a "FREE PASS" to continue polluting until 2030, but expect the USA to Cut emissions even further? If the Problem is a serious as you want us to believe, why NOT cut emissions across the board? Not just in the USA and Europe, but in China, India, Pakistan, UAE, Saudi Arabia, Iran, Iraq, and the Rest of the O.P.E.C. region. No, that will not happen, because this is not about changing anything, it is about getting the USA to yet again pay for something, so the Rest of the DEADBEATS in France, Germany, Italy, UK, Japan don't have to pay. You and I both know it is IMPOSSIBLE, to eliminate ALL Green House Gasses. You would have to Plug up Every Volcano, and Thermal Feature around the Planet to do so. Heck, Yellowstone alone emits more Green House Gasses each year than ALL of Europe. So, good Luck with that!
Aviador Replied to joe306tow
Well said. I subscribe. If there was a serious problem, USA and Europe wouldn't allow the other countries to pollute a dime. But who is going to pay is not the USA alone... As in Europe thats the mainstreaming. And you can't argue cause you might be killed...
One thing is fore sure, someone is getting reacher... And i think ...buys houses at the sea shore ...while others cant produce.
The question is what's the covered intention? Personal?. Or we are trying to force some countries, not to produce anything, intentionally?
PS: the new generation "how dare youS" are the most polluter ever. Always with their iphones logged in, tvs on, game and computers at home, processed food eaten all days, always moving by transportation... why don't they stop using this stuff instead of skipping classes? By the way.. i think there are enough kids skipping classes in Africa. Maybe the American and European don't need.
ralphie_the_buffalo
This paper needs to be RETRACTED, not corrected. It is a travesty of scientific research and needs to be relegated to a deep rabbit hole, scrub it!
B1663r
So it appears the paper has been totally retracted now. Am I to understand the attempted corrections to the paper failed? Then the scientist claims the paper is still valid even though Nature has forced them to retract paper. Can some one please explain to me what is going on?
Dude1394
It appears you are science deniers. I mean the consensus, the consensus.