
Abstract
Atherosclerosis is the main underlying cause of cardiovascular diseases. Its prevention is based on the detection and treatment of traditional cardiovascular risk factors1. However, individuals at risk for early vascular disease often remain unidentified2. Recent research has identified new molecules in the pathophysiology of atherosclerosis3, highlighting the need for alternative disease biomarkers and therapeutic targets to improve early diagnosis and therapy efficacy. Here, we observed that imidazole propionate (ImP), produced by microorganisms, is associated with the extent of atherosclerosis in mice and in two independent human cohorts. Furthermore, ImP administration to atherosclerosis-prone mice fed with chow diet was sufficient to induce atherosclerosis without altering the lipid profile, and was linked to activation of both systemic and local innate and adaptive immunity and inflammation. Specifically, we found that ImP caused atherosclerosis through the imidazoline-1 receptor (I1R, also known as nischarin) in myeloid cells. Blocking this ImP–I1R axis inhibited the development of atherosclerosis induced by ImP or high-cholesterol diet in mice. Identification of the strong association of ImP with active atherosclerosis and the contribution of the ImP–I1R axis to disease progression opens new avenues for improving the early diagnosis and personalized therapy of atherosclerosis.
Main
Cardiovascular disease (CVD) is a leading cause of death worldwide, with atherosclerosis being its main determinant. Despite advances in prevention and therapy, the increase in CVD-linked morbidity and mortality highlights the need for early interventions in seemingly healthy populations. Atherosclerosis is a complex multifactorial disease whose prevention is based on traditional cardiovascular risk factor-based scores1 that do not identify individuals at risk for atherosclerotic vascular disease at early stages2. Moreover, the main pharmacological interventions are bound to established risk factors (lipid metabolism4 and recently inflammation5,6). This emphasizes the need for exploration of treatments that target other factors in the pathophysiology of atherosclerosis3, particularly for patients who, despite optimal treatment, still have significant residual cardiovascular risk6,7,8.
Crosstalk between the metabolisms of the microbiota and host contributes to CVD9,10,11. However, only a few gut microbiota-dependent metabolites that correlate with late stages of the disease have been described11,12. We sought to identify microbial metabolites associated with early stages of atherosclerotic vascular disease that could contribute to atherosclerosis progression.
Untargeted metabolomics links ImP to atherosclerosis in mice
To screen for microbial metabolites that could affect atherosclerosis progression, we fed atherosclerosis-prone Apoe−/− mice different diets with or without antibiotic treatment to deplete the microbiota13 (Extended Data Fig. 1a). High-cholesterol (HC) diets induced atherosclerosis, which was partially prevented upon antibiotic treatment with HC diet supplemented with choline (HC/HC) (Fig. 1a). Untargeted metabolomics showed a substantial reshaping of the plasma metabolome (Fig. 1b,c) associated with altered gut microbiota composition (Fig. 1d,e and Extended Data Fig. 1b) upon diet and antibiotic administration. First, we validated the metabolomics by demonstrating that the host-microbial co-metabolite, trimethylamine N-oxide (TMAO) was induced by the addition of dietary choline and associated with atherosclerosis in a microbiota-dependent manner14 (Extended Data Fig. 1c,d). Notably, we identified ImP, a microbiota-dependent metabolite15, to be highly associated with atherosclerosis upon HC feeding (Fig. 1f,g and Extended Data Fig. 1e). Plasma ImP concentration was also associated with changes in the gut microbial ecology upon dietary intervention, particularly with a relative enrichment of Escherichia and Shigella, or Eubacterium (Fig. 1h). However, identification of specific strains with the capacity to produce ImP requires further investigation.
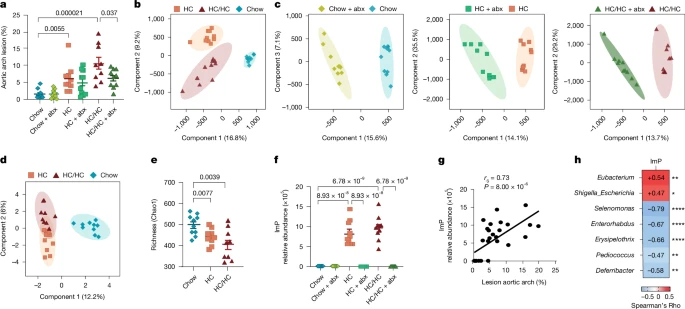
Apoe−/− mice were fed chow, HC diet or HC/HC diet with or without antibiotics (abx) in the drinking water. a, Quantification of atherosclerotic plaque lesion size in the aortic arch by Oil red O staining. Each point represents an individual mouse (n = 10 per group for all conditions, except chow-fed mice administered antibiotics and HC/HC-fed mice, n = 9). b–d, Score plots of partial least squares discriminant analysis (PLS-DA) performed on liquid chromatography–mass spectrometry (LC–MS) data of plasma samples collected at endpoint (euthanasia) (n = 10 per group) for the three diets (b) and the three diets with antibiotics (c) and 16S rDNA sequencing analysis of caecal samples collected at endpoint (chow, HC, n = 10; HC/HC, n = 9) (d). e, Chao1 richness analysis of microbiota diversity. f,g, ImP relative abundance in plasma from Apoe−/− male mice at endpoint measured by untargeted LC–MS (f) and correlation with aortic arch lesion (g). h, Correlation matrix showing the correlation between ImP and gut microbiota genera (>0.1% of total abundance) in caecal samples from Apoe−/− mice fed chow, HC or HC/HC diets for 8 weeks. Data are pooled from two independent experiments (chow, HC, n = 10; HC/HC, n = 9). g,h, Correlation coefficient (rs) and P values are calculated by Spearman’s rank-order correlation test. a,e,f, Individual data and arithmetic mean ± s.e.m. of each group are shown. Two-sided one-way ANOVA with Tukey post hoc correction. *P < 0.05, **P < 0.01, ****P < 0.0001.
ImP is linked to subclinical atherosclerosis in humans
Next, we aimed to investigate whether increased plasma concentration of ImP was also associated with atherosclerosis in humans. We recruited 400 asymptomatic volunteers from the Progression of Early Subclinical Atherosclerosis (PESA)-Centro Nacional de Investigaciones Cardiovasculares (CNIC)-Santander prospective cohort (hereafter the PESA cohort) study2 (Supplementary Table 1a,b). On the basis of multiterritorial and multimodal imaging (2D or 3D vascular ultrasonography and non-contrast computed tomography), we classified 295 participants with subclinical atherosclerosis and 105 controls without atherosclerosis. Extent of atherosclerosis was defined according to the number of affected vascular sites and the coronary artery calcium (CAC) score. Targeted metabolomics was used to quantify ImP and its related metabolites (histidine and urocanic acid)15 in plasma samples. Plasma concentrations of ImP, but not histidine or urocanic acid, were selectively increased in individuals with subclinical atherosclerosis compared with controls (Fig. 2a and Extended Data Fig. 2a). Linear and non-linear associations were observed between ImP concentrations and atherosclerosis and extent of atherosclerosis, respectively (Fig. 2b). ImP was subsequently measured in an independent cohort, the impaired glucose tolerance (IGT) cohort (Supplementary Table 2a,b), comprising asymptomatic volunteers, including 529 controls and 1,315 individuals with subclinical atherosclerosis16. Notably, the association between ImP and early atherosclerosis was confirmed (Fig. 2c,d and Extended Data Fig. 2a).

a,c, Plasma ImP in healthy individuals (Ctrl) and individuals with subclinical atherosclerosis (AT) from the PESA (a; Ctrl, n = 105; AT, n = 295) and IGT (c; Ctrl, n = 529; AT, n = 1,315) cohorts. b,d, Dose–response curves of plasma ImP concentration and endpoints in the PESA (b) and IGT (d) cohorts. e,f, Spearman correlation matrices between ImP and atherosclerosis traits, diet and microbiota in the PESA (e) and IGT (f) cohorts. Benjamini–Hochberg adjusted P values. ALT, alanine aminotransferase; AST, aspartate aminotransferase; BM, bone marrow; ECO2D, 2D vascular ultrasound; ECO3D, 3D vascular ultrasound; F, familial; GFR, glomerular filtration rate; GGT, gamma-glutamyl transferase; HTN, hypertension. g, Adjusted regression models for the association of ImP with atherosclerosis (left) and extent of atherosclerosis (right) in the PESA (top, n = 400) and IGT (bottom, n = 1,844) cohorts. Effect estimates were controlled for age, sex, smoking, creatinine, family history of CVD, haemoglobin, hypertension and LDL-C (PESA cohort) and age, smoking, family history of CVD, hypertension, LDL-C, Hb1Ac, hs-CRP and ALT (IGT cohort). Error bars show 95% confidence intervals. OR, odds ratio. h,j, Plasma ImP in individuals with inactive atherosclerosis (FDG−, n = 74) and active atherosclerosis (FDG+, n = 221) (h). FDG+ individuals were further stratified according to vascular inflammation (arterial 18F-FDG uptake, FDG+_A, n = 57), bone marrow activation (18F-FDG uptake in bone marrow, FDG+_BM, n = 40) and systemic inflammation (concurrent arterial and bone marrow 18F-FDG uptake, FDG+_SYS, n = 124) (j). FDG– refers to the group of inactive atherosclerosis. a,c,h,j, Horizontal line represents median and error bars show interquartile range (Supplementary Tables 1a, 2a and 4). Two-tailed Mann–Whitney U-test. i, Dose–response curve for plasma ImP effect on active atherosclerosis for the PESA cohort. b,d,i, Dashed lines represent the 95% confidence interval; vertical lines delineate tertiles. k, Multinomial logistic regression for subclinical atherosclerosis in the atherosclerosis subgroups (FDG+_SYS, FDG+_BM, FDG+_A and FDG−) versus controls according to plasma ImP. Odds ratio was adjusted for age, sex, smoking, glucose, hs-CRP and haemoglobin concentration. g,k, Whiskers indicate 95% confidence intervals (values in Supplementary Tables 3 and 5). ***P < 0.001.
We further explored the association between ImP, dietary patterns and the microbiota composition. Among the five main principal component analysis (PCA)-derived dietary patterns in the PESA cohort (Extended Data Fig. 2b), ImP was inversely correlated with a Breakfast1 and a Mediterranean dietary pattern (Fig. 2e), consistent with previous findings17. 16S ribosomal DNA (rDNA) sequencing of faecal samples detected a direct correlation of ImP with the relative abundance of Veillonella and Acidaminococcus, and inverse correlation with Erysipelotrichaceae and Coriobacteriaceae families (Fig. 2e), which are altered in individuals with CVD18,19.
Next, we investigated the association between plasma ImP and established cardiovascular risk factors. In both cohorts, ImP directly correlated with fasting glucose and an adverse cardiometabolic profile, including increased high-sensitivity C-reactive protein (hs-CRP), body mass index (BMI), visceral fat, dyslipidaemia and hypertension, and lower high-density lipoprotein (HDL)-cholesterol (Fig. 2e,f and Supplementary Tables 1b and 2b). The prevalence of atherosclerosis endpoints and the CAC score also increased across ascending ImP tertiles (Supplementary Tables 1b and 2b). After adjusting for traditional risk factors in both cohorts, higher ImP levels were independently associated with main atherosclerosis outcomes (Fig. 2g and Supplementary Table 3), suggesting high ImP levels as indicator of increased atherosclerosis risk. Of note, ImP also showed additive value when added to established blood-derived atherosclerosis biomarkers such as low-density lipoprotein (LDL)-cholesterol and hs-CRP in discriminating atherosclerosis prevalence in both cohorts (Extended Data Fig. 2c,d).
In the PESA cohort, individuals with subclinical atherosclerosis were further classified by 18F-fluorodeoxyglucose (18F-FDG) uptake in arteries and/or bone marrow activation into those with metabolically active atherosclerosis (FDG+) or not (FDG−)20,21. Increased ImP plasma concentration was observed in the FDG+ group, following a non-linear association with the outcome (Fig. 2h,i). Further stratification by 18F-FDG uptake (Extended Data Fig. 2e and Supplementary Table 4) revealed higher plasma ImP concentration in the subgroups of bone marrow activation (FDG+_BM) and systemic inflammation (FDG+_SYS; Fig. 2j). Notably, after adjusting for conventional risk factors, the association between ImP and increased risk remained significant across all subgroups of metabolically active FDG+ atherosclerosis (Fig. 2k and Supplementary Table 5). Additionally, ImP demonstrated additive discriminative ability for active atherosclerosis over LDL-cholesterol and hs-CRP alone (Extended Data Fig. 2c,d). These findings reveal a strong association between ImP and atherosclerosis, particularly active atherosclerosis, suggesting its potential use as an indicator of early active atherosclerosis before other comorbidities become confounding factors.
ImP causes atherosclerosis without cholesterol change
To further explore the effect of ImP on atherosclerosis and determine whether it causally contributed to the development of the early stages of the disease, we administered ImP in the drinking water of atherosclerosis-prone mice, including chow-fed Ldlr−/− mice, which we treated with ImP for 12 weeks (Fig. 3a and Extended Data Fig. 3a,b) and chow-fed Apoe−/− mice, which we treated with ImP for 8 weeks (Fig. 3b and Extended Data Fig. 3c–e). In both models, ImP supplementation increased atherosclerosis development in the aorta and aortic root without affecting circulating cholesterol or glucose concentration (Fig. 3a,b and Extended Data Fig. 3a–e). Feeding with HC diet alone induced ImP production (Fig. 1f). Additional ImP supplementation did not significantly exacerbate atherosclerosis in HC-fed Apoe−/− mice, although it further increased atherosclerotic lesions in Ldlr−/− mice (Extended Data Fig. 3f,g). Thus, to establish a direct ImP-dependent model of atherosclerosis for subsequent investigations, we administered ImP exclusively to chow-fed mice. Notably, Apoe−/− mice treated with ImP for eight weeks showed an expansion of proinflammatory Ly6Chi monocytes, and T helper 1 TH1 and T helper 17 (TH17) cells (Fig. 3c,d and Extended Data Fig. 4a) in the blood, which are associated with a proatherogenic environment22.
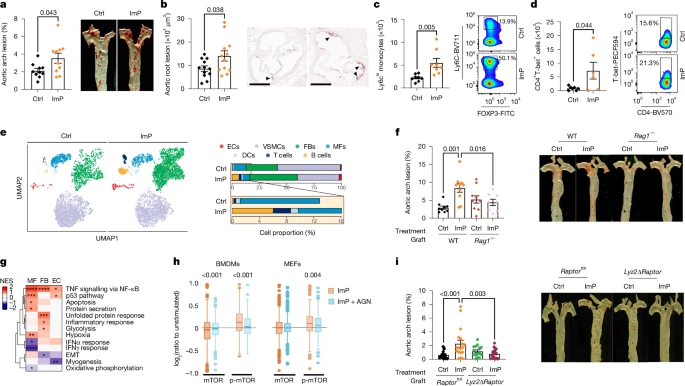
a, ImP was administered (ImP) or not (Ctrl) to chow-fed Ldlr−/− mice. Oil red O staining of aortic arch (left, n = 10) and representative images of aorta (right). b–e, ImP was administered (ImP) or not (Ctrl) to Apoe−/− mice. b, Quantification (left) and representative images (right) of Oil red O staining of aortic root lesions. n = 12. Arrowheads indicate areas with positive Oil red O staining. Scale bars, 500 µm. c,d, Flow cytometry analysis of Ly6Chi monocytes (n = 8) (c) and T-bet in CD4+ T cells (n = 6) (d) in blood at endpoint. Right, representative density plots for Ctrl and ImP. e, Uniform manifold approximation and projection (UMAP) embedding (left) and cell proportions (right) labelled by cell type of cells derived from whole aorta, based on transcriptomic profiles. DCs, dendritic cells; ECs, endothelial cells; FBs, fibroblasts; MFs, macrophages; VSMCs, vascular smooth muscle cells. f, Ldlr−/− mice grafted with bone marrow from wild-type (WT) (Ctrl, n = 9; ImP, n = 10) or Rag1−/− (Ctrl, n = 10; ImP, n = 8). Atherosclerosis by Oil red O staining of aortic arch (left) and representative images of aorta (right). g, Heat map of GSEA comparing ImP versus control for endothelial cells, fibroblasts and macrophages from scRNA-seq data of Apoe−/− mice fed chow diet for 4 weeks. EMT, epithelial–mesenchymal transition; NES, normalized enrichment score. h, Global abundance of peptides (mTOR) and phosphopeptides (p-mTOR) in BMDMs (left) or MEFs (right) treated with ImP for 3 h with or without AGN192403 (AGN). The log2 ratio is relative to unstimulated conditions. i, Ldlr−/− mice grafted with bone marrow from control Raptorfl/fl (Ctrl, n = 17; ImP, n = 18) or Lyz2ΔRaptor (Ctrl, n = 15; ImP, n = 18). Quantification (left) and representative images (i) of Oil red O staining of aorta, showing atherosclerosis in aortic arch. a–d,f,i, Individual data points and mean ± s.e.m. of at least two pooled independent experiments. a–d, Two-tailed unpaired Student’s t-test. f,i, One-way ANOVA with Tukey post hoc correction. g, Two-tailed Kolmogorov–Smirnov test comparing ImP versus unstimulated. h, Two-tailed Wilcoxon signed rank test comparing peptide and phosphopeptide abundance in ImP versus ImP plus AGN treatments.
To further understand the specific changes induced by ImP in the aorta, we performed single-cell RNA-sequencing (scRNA-seq) analysis of the whole aorta from chow-fed Apoe−/− mice that were administered ImP for four or eight weeks (Extended Data Fig. 4b–e). Mice treated with ImP for four weeks showed a mild increase in aortic arch atherosclerosis (Extended Data Fig. 4f), and some local changes in cell population frequency in the aorta (Extended Data Fig. 4e), without changes in circulating immune cells (Extended Data Fig. 4g,h). By contrast, scRNA-seq of aortas from mice treated with ImP for eight weeks revealed an increase in the relative number of fibroblasts, endothelial cells and immune cells (Fig. 3e). The increased number of immune cells in the aorta was confirmed by flow cytometry analysis (Extended Data Fig. 4i) and histological analysis of the aortic root, which showed increased T cell infiltration in the intima–media layer and increased MAC2 staining for inflammatory macrophages in the atheroma plaque of ImP-treated mice compared with controls (Extended Data Fig. 4j,k). Remarkably, the ability of ImP to induce atherosclerosis was markedly reduced in Ldlr−/− mice grafted with Rag1−/− bone marrow, which lacks T and B cells (Fig. 3f and Extended Data Fig. 4l). These data identify ImP as a novel contributor to atherosclerosis aetiology in atherosclerosis-prone mice that is associated with activation of the immune response without affecting the bloodstream concentration of cholesterol.
In vivo ImP alters the aortic transcriptome
To further dissect cellular targets of ImP in the aorta, we investigated transcriptional changes using scRNA-seq analysis after four weeks of treatment. Gene set enrichment analysis (GSEA) of each cell type showed increased inflammation-associated transcriptional pathways in macrophages, fibroblasts and endothelial cells following ImP treatment (Fig. 3g). Reclustering of each cell type in independent analyses identified four macrophage, five fibroblast and three endothelial cell subclusters (Extended Data Fig. 5a–c). Analysis of the ImP effect in these subclusters (including four- and eight-week data) showed a reduction in the MF1 cluster associated with homeostatic genes23, and an increase in the MF3 cluster expressing genes associated with lipid metabolism, inflammation and macrophage activation24,25,26 (Extended Data Fig. 5d,g). Increased ImP in the circulation induced expansion of aortic FB2, FB3 and FB4 subsets, which were characterized by the expression of genes associated with acetylcholine response, immune response and inflammation, and extracellular matrix organization, respectively (Extended Data Fig. 5e,g). Finally, the EC1 subset, which highly expressed genes regulating endothelial cell function27, mesenchymal markers28 and proangiogenesis genes29,30,31,32 was enriched in the aorta after ImP treatment (Extended Data Fig. 5f,g).
Consistent with these results, ImP was able to activate in vitro mouse embryonic fibroblasts (MEFs) by inducing the production of active monocyte chemoattractant protein-1, which increases monocyte recruitment (Extended Data Fig. 5h,i) associated with atherogenesis33. Moreover, RNA-sequencing (RNA-seq) analysis showed a rapid induction of many inflammatory and activation pathways following ImP administration, particularly in bone marrow-derived macrophages (BMDMs) and in MEFs, but not in mouse aortic endothelial cells (MAECs) (Extended Data Fig. 5j), suggesting that macrophages and fibroblasts could be main targets of ImP. Of note, phosphoproteomic analysis showed increased global abundance of phosphopeptides belonging to the mTOR pathway in BMDMs and MEFs upon ImP treatment (Fig. 3h and Extended Data Fig. 5k). These results were in agreement with previous findings in primary hepatocytes15 and the increased phosphorylated-S6 (p-S6) signal (indicative of mTOR activation) that we found in BMDMs and MEFs following ImP treatment (Extended Data Fig. 5l). Further, pre-incubation with the mTOR inhibitor, rapamycin, prevented the induction of TNF production by ImP in BMDMs and MEFs (Extended Data Fig. 5m). Apoe−/− mice fed chow diet and administered ImP for 8 weeks also had increased p-S6 in peritoneal macrophages (Extended Data Fig. 5n). Notably, selective deletion of Raptor34 (also known as Rptor; associated with mTOR regulation) in myeloid cells of Ldlr−/− mice grafted with bone marrow from Lyz2ΔRaptor versus control Raptorfl/fl littermates prevented the induction of atherosclerosis by ImP (Fig. 3i and Extended Data Fig. 5o). These data show that ImP directly activates an mTOR-dependent inflammatory response in myeloid cells, contributing to atherogenesis.
ImP drives atherosclerosis via I1R in myeloid cells
Since ImP contains an imidazole ring, we hypothesized that it could be sensed by the ubiquitously expressed imidazoline receptors I1R and I2R35. We thus treated BMDMs and MEFs with ImP in the presence of AGN192403 (I1R antagonist)36 or idazoxan (imidazoline receptor antagonist)35. Since several imidazoline receptor ligands may also bind α2-adrenoceptors (for example, idazoxan), we included yohimbine (a α2-adrenoceptor antagonist with low affinity for imidazoline receptors)35. ImP increased p-S6 and induced TNF in BMDMs and MEFs, and this effect was selectively blocked by AGN192403 (Extended Data Fig. 6a,b). Phosphoproteomic analysis further confirmed that AGN192403 inhibited ImP-induced mTOR pathway activation (Fig. 3h). Silencing of I1R by small inhibitory RNAs (siRNAs) targeting Nisch in MEFs blocked ImP-induced p-S6 and TNF production, revealing that ImP signals selectively through I1R for these inflammatory functions. Of note, AGN192403 prevented ImP-induced p-S6 or TNF in control siRNA-treated cells but had no effect in I1R-silenced cells, consistent with the selective effect of this inhibitor on the ImP–I1R axis (Extended Data Fig. 6c,d).
To further analyse the function of ImP in myeloid cells we mated Lyz2-cre mice with Nischfl/fl mice to generate Lyz2ΔNisch mice. Analysis of Nisch expression showed a selective deletion in spleen myeloid cells, in contrast to maintained expression in CD3+ T cells of Lyz2ΔNisch mice compared with control Nischfl/fl mice (Extended Data Fig. 6e). Notably, ImP-driven induction of p-S6 and TNF production by BMDMs was fully dependent on Nisch (Extended Data Fig. 6f,g), confirming I1R as the host ImP receptor. To determine whether blocking the ImP–I1R axis in myeloid cells would prevent the atherogenic effects of ImP, we administered ImP to Ldlr−/− CD45.1 mice grafted with bone marrow from Nischfl/fl or Lyz2ΔNisch mice. The absence of I1R in myeloid cells prevented ImP-induced atherosclerosis (Fig. 4a and Extended Data Fig. 6h).
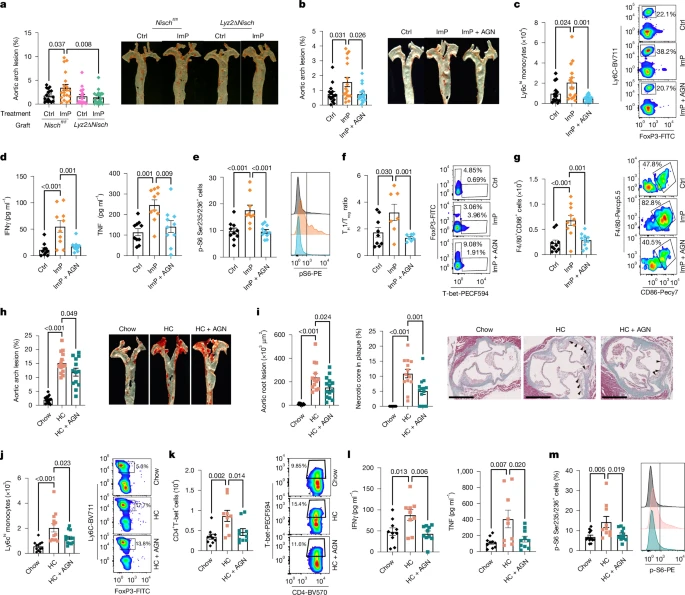
a, Ldlr−/− mice grafted with bone marrow from control Nischfl/fl (Ctrl, n = 17; ImP, n = 20) or Lyz2ΔNisch (Ctrl, n = 19; ImP, n = 18) and fed chow diet for 12 weeks. Oil red O staining of aortic arch (left) and representative images of aorta (right). b–g, Chow-fed Apoe−/− mice were treated as indicated. b, Oil red O staining of aortic arch (left) and representative images of aorta (right). Ctrl, n = 15; ImP, n = 17; ImP + AGN, n = 16. c, Left, Ly6Chi monocytes in blood at endpoint (n = 15). Right, representative density plots. d, IFNγ and TNF in plasma. n = 10. e, Left, p-S6 staining in peritoneal macrophages. Ctrl, n = 10; ImP, n = 9; ImP + AGN, n = 10. Right, representative histograms. f, Ratio of TH1 to Treg cells infiltrated in aorta. Ctrl, n = 9; ImP, n = 7, ImP + AGN, n = 7. g, F4/80+CD86+ cells infiltrated in aorta. n = 10. f,g, Left, individual data. Right, representative density plots. h–m, Apoe−/− mice were fed a chow diet or HC diet for 8 weeks; AGN192403 was added to the HC group (HC + AGN) in the last 4 weeks. h, Oil red O staining of aortic arch (left) and representative images of aorta (right). Chow, n = 15; HC, n = 14; HC + AGN, n = 13. i, Masson’s trichrome staining of aortic roots. Quantification of lesions in aortic roots (left), necrotic core area (middle) and representative images (right). Arrowheads indicate necrotic areas. Chow, n = 12; HC, n = 13; HC + AGN, n = 14. Scale bars, 500 µm. j,k, Individual data (left) and representative density plots (right) for flow cytometry quantification of blood Ly6Chi monocytes (j; chow, n = 12; HC, n = 13; HC + AGN, n = 13) and T-bet+ CD4+ TH1 cells (k; chow, n = 10; HC, n = 9; HC + AGN, n = 10). l, Plasma IFNγ and TNF. Chow, n = 10; HC, n = 9; HC + AGN, n = 10. m, Individual data (left; chow, n = 12; HC, n = 10; HC + AGN, n = 11) and representative histograms (right) for p-S6 staining in peritoneal macrophages. a–m, Individual data points and mean ± s.e.m. from at least two pooled independent experiments. One-way ANOVA with Tukey post hoc correction.
To analyse the potential use of AGN192403 to prevent ImP-induced atherosclerosis we co-administered ImP and AGN192403 in drinking water to chow-fed Apoe−/− mice for eight weeks. We observed that treatment with AGN192403 inhibited the formation of ImP-induced atherosclerotic plaques in both male and female mice (Fig. 4b and Extended Data Fig. 7a,b), without affecting total cholesterol or ImP concentration in plasma (Extended Data Fig. 7c,d). AGN192403 treatment prevented ImP-induced expansion of Ly6Chi monocytes and TH1 cells, production of proinflammatory cytokines, increase in circulating B and T cells and ImP-mediated p-S6 in peritoneal macrophages (Fig. 4c–e and Extended Data Fig. 7f). Moreover, AGN192403 treatment affected infiltration of immune cells in the aorta, by locally blocking the ability of ImP to increase the TH1/T regulatory (Treg) cell ratio (Fig. 4f and Extended Data Fig. 7g,h) and preventing ImP-induced infiltration of proinflammatory macrophages and B cells (Fig. 4g and Extended Data Fig. 7i,j). These results show that specific I1R deletion in myeloid cells and AGN192403 block ImP-induced atherosclerosis in chow-fed atherosclerosis-prone mice.
ImP–I1R blockade prevents atherosclerosis progression
To assess the capacity of the ImP–I1R axis inhibition to treat atherosclerosis, we fed Apoe−/− mice chow or HC diets for eight weeks and treated or not with AGN192403 in the last four weeks of the HC diet. HC diet induced atherosclerosis and ImP production, and treatment with AGN192403 inhibited the progression of atherosclerosis in male and female mice, without affecting ImP concentration (Fig. 4h and Extended Data Fig. 8a–c). Notably, this treatment also reduced plaque size, necrotic core extension and caspase-3 staining (Fig. 4i and Extended Data Fig. 8d), indicative of reduced plaque complexity in mice37. Yet, this protective effect did not affect the increase in cholesterol concentration in mice fed the HC diet (Extended Data Fig. 8e). Moreover, AGN192403 treatment prevented HC diet-dependent induction of blood Ly6Chi monocytes, TH1 immunity and proinflammatory cytokines (Fig. 4j–l). The treatment also impaired HC diet-driven p-S6 induction in peritoneal macrophages (Fig. 4m). These results demonstrate that the administration of AGN192403, which inhibits the ImP–I1R axis, prevents atherosclerosis linked to immune cell activation without affecting cholesterol concentration in plasma, suggesting a novel approach for atherosclerosis therapy.
Discussion
The complex aetiology of CVDs and the silent nature of atherosclerosis pose challenges to the detection of early stages of disease. Previous studies have focused on associations of ImP and other microbiota-dependent metabolites with advanced stages of CVD or mortality10,38,39,40. Specifically, ImP has been related to type 2 diabetes, cardiometabolic disease in people with HIV, coronary artery disease and heart failure15,38,40,41,42,43. Here, we demonstrate that ImP is associated with atherosclerosis progression in mice and with subclinical active atherosclerosis in an otherwise healthy cohort, in whom atherosclerosis is detected solely through advanced imaging studies that are unavailable in the clinical practice for large population screenings44. These findings were independently validated in an additional IGT cohort, despite differences in the median ImP concentration in the PESA cohort, further supporting the association between ImP and early atherosclerosis and suggesting its use as a companion diagnostic and therapeutic target for personalized medicine. Moreover, we demonstrate that ImP induces atherosclerosis without influencing blood cholesterol concentration. Proatherogenic effects of ImP can be pleiotropic and act on multiple cell types45,46. We observed that administration of ImP induced local increase in transcriptional activity in macrophages, fibroblasts and—to a lesser extent—endothelial cells. These transcriptional changes were characterized by enhanced immune cell recruitment and inflammation, which could underlie the atherosclerosis-prone effect of ImP. In addition, ImP activated proatherogenic systemic innate and adaptive responses leading to increased infiltration by immune cells of aortic roots, contributing to atherosclerosis progression46, which further correlates with clinical complications and unstable or vulnerable plaque47,48. Although ImP administration does not affect glucose concentration, blood pressure and some renal and liver function parameters, we cannot rule out that other systemic effects could contribute to the pathology, which will have to be addressed in future studies.
We identify I1R as a receptor for ImP that induces p-S6 and proinflammatory cytokine production, consistent with mTOR activation in macrophages contributing to atherosclerosis37,49. We find that ImP-induced atherosclerosis is fully dependent on I1R expression in myeloid cells. However, given the expression and transcriptional effects of ImP in other cell types that contribute to atherosclerosis (fibroblasts and endothelial cells), ImP may also affect these cells by boosting atherosclerosis43. Pharmacological blockade of I1R inhibits atherosclerosis progression and the inflammatory response induced by ImP or HC diet, independently of changes in cholesterol concentration but dependent on mTOR blocking in macrophages. Notably, I1R blockade also reduced caspase-3 staining and necrotic core at the plaque as readouts for plaque complexity associated with active and unstable plaque37, which could underlie its association with heart failure38. Lipid-lowering therapy is currently used to prevent atherosclerosis progression. However, the rate of cardiovascular events remains high even in patients receiving appropriate lipid-lowering treatments6,7,8. Although other therapies are available, they are not yet established for atherosclerosis treatment and are generally bound to established risk factors5,50,51. Thus, we propose the ImP–I1R axis in myeloid cells as an independent target for atherosclerosis therapy that may potentially synergize with current treatments.
Methods
Mice
Mice were bred and maintained in groups of five animals per cage at the CNIC under specific pathogen-free conditions. We used proatherogenic background B6.129P2-Apoetm1Unc/J mice (The Jackson Laboratory, strain 002052, Apoe−/−); B6.129S7-Ldlrtm1Her/J mice (The Jackson Laboratory, strain 002207, Ldlr−/−) backcrossed with B6.SJL-Ptprca Pepcb/BoyJ mice expressing the CD45.1 congenic marker (The Jackson Laboratory, strain 002014, B6 CD45.1); B6.129S7-Rag1tm1Mom/J mice (The Jackson Laboratory, strain 002216, Rag1–/–); B6.Cg-Rptortm1.1Dmsa/J mice (The Jackson Laboratory, strain 013188, RaploxP) were mated with B6.129P2-Lyz2tm1(cre)Ifo/J mice (The Jackson Laboratory, strain 004781, Lyz2-cre) to generate Lyz2ΔRaptor (Cre+) and control Raptorfl/fl (Cre−) littermates used as controls. Sperm from B6.Nischtm1a(EUCOMM)Hmgu>/H mice (Mary Lyon Centre at MRC Harwell, UK; EM:08808) was used for in vitro fertilization of ROSA-Flpe mice (Gt(ROSA)26Sortm1(FLP1)Dym) to generate Nischfl/fl mice (tm1c). Nischfl/fl mice were mated with Lyz2-cre (B6.129P2-Lyz2tm1(cre)Ifo/J) mice to generate Lyz2ΔNisch (Cre+) and control Nischfl/fl (Cre−) littermates used as controls. Mice were 7- to 12-week-old at the initiation of experiments. Littermates of the same sex were randomly assigned to experimental groups. Investigators were blinded to group allocation during data collection and analysis to reduce bias. Animal studies were approved by the local ethics committee at CNIC, UAM and Comunidad de Madrid, PROEX 300.4/21 and PROEX 119.6/22. All animal procedures conformed to European Union Directive 2010/63EU and Recommendation 2007/526/EC regarding the protection of animals used for experimental and other scientific purposes, enforced by Spanish law under Real Decreto 53/2013. Mice were fed different diets, including chow, HC (10% fat, 0.75% cholesterol, SSNIFF S9167-E011) and HC/HC (HC + 1% choline, SSNIFF S9167-E016), as indicated in each experiment. ImP (400 μg per mouse per day, Biogen Cientifica BA-F-3185.0001) was administered in the drinking water. AGN192403 (30 μg per mouse per day, Labclinics B6583-10) was administered in the drinking water.
Antibiotic administration
For ablation of intestinal bacteria, an antibiotic cocktail of 1 g l−1 each of ampicillin (Normon), neomycin sulfate (Sigma Aldrich) and metronidazole (Sanofi), 0.5 g l−1 vancomycin (Normon) and 4 mg ml−1 sucralose (Sigma Aldrich) dissolved in water was used and replenished every three days as described52.
Quantification of lesions in the aorta
For atherosclerotic lesion measurements, Apoe−/− or Ldlr−/− male or female mice were fed a chow or high-cholesterol diet for 4, 8 or 12 weeks, as indicated in each experiment. Blood was collected from submandibularly punctured mice. Next, mice were perfused with 10 ml phosphate buffered saline (PBS) via cardiac puncture to remove blood contamination from vascular tissue. The aortas were dissected and fixed in formaldehyde 4% w/w (PanReac, AppliChem) at room temperature overnight. Then, the exposed aortas were stained for lipid depositions with Oil Red O (Sigma Aldrich) prior en face assay assessment. In brief, after fixation, aortas were washed with 60% isopropanol and stained for one hour with 2.5 mg ml−1 of Oil Red O. After two washing steps of 5 min with isopropanol 60%, aortas were stored in PBS-azide 0.05%. Images were taken with Leica Nikon camera magnifier and atherosclerotic lesions in the aorta were quantified by calculating the ratio of the lesion area to the total surface area. This measurement was carried out using an automated method that quantifies lipid accumulation in the lesions by applying colour thresholding to the Oil red O-positive areas. The threshold was set by the researcher and remained consistent within the same staining batch, as described53. Analysis of the images was performed using ImageJ software.
Aortic roots histology
Perfused hearts were fixed with 4% formaldehyde for 48 h at room temperature. For paraffin sectioning, fixed hearts were incubated overnight in 70% ethanol and embedded in paraffin blocks. Four-micrometre sections of the aortic roots were cut and dried overnight at 37 °C. The trichrome protocol used was a standard Masson’s trichrome protocol using Weigert’s haematoxylin for nuclei and light green as a collagen stain. Trichrome stain was used to analyse plaque and necrotic core (identified as unstrained regions inside plaque). T cell staining in the heart aortic roots was performed by immunohistochemistry using a CD3 antibody (Invitrogen, MA1-90582). Macrophage staining in the atheroma plaque was performed by immunohistochemestry using a MAC2 antibody (Invitrogen, 14-5302-85). Caspase-3 staining was carried out in the heart aortic roots using anti-caspase-3 antibody (Cell Signaling Technology, 9661). Staining was performed in an automated autostainer (Autostainer Plus, Dako). As secondary antibodies we used anti-rabbit (Dako Envision K4003) for CD3 and caspase-3 staining and rabbit anti-rat (Abcam Ab6734) for MAC2. The digitalized images were obtained using the Carl Zeiss Axio Scan Z1 scanner. Analysis of the images was performed using NDPview 2 and ImageJ software.
Caecal content collection
At the culling, the caecum was resected and rinsed with PBS to collect its contents, which were stored at −80 °C until sample processing.
Serum analysis
Blood samples were obtained by cardiac puncture. The serum was collected after blood centrifugation at 1,000g for 10 min and frozen at −80 °C. Serum biochemical parameters were analysed with a Dimension RxL Max automated analyser the day after the extraction. Glucose and protein content were measured with Dimension RxL Max automated analyser.
LC–MS untargeted metabolomics
Materials
LC–MS grade acetonitrile was from Fluka Analytical; methanol and water were from Fischer Scientific; ethanol was from Merck and formic acid was from Honeywell Fluka.
Sample preparation
Plasma samples (50 µl) were prepared as described54. In brief, proteins were removed by adding a cold (−20 °C) mixture of methanol:ethanol (1:1, v/v) in a ratio 5:1 (solvent:sample) and by storing the samples on ice for 20 min. Blank sample was prepared following the same extraction procedure, adding only the solvents to a 1.5 ml Eppendorf tube. Quality control samples (QCs) were prepared by pooling 100 µl plasma samples from independent Apoe−/− mice and following the same extraction procedures. Samples, QCs and blank, were centrifuged at 16,400g for 20 min 4 °C and the supernatant was transferred in a 1.5 ml Eppendorf tube. Supernatants were subsequently dried-out in speedvac (Savant SPD131DDA concentrator, Savant RVT5105 refrigerated vapour trap and OFP400 vacuum pump, Thermo Fisher Scientific) for 2 h at room temperature. Before LC–MS analysis, the dried samples and QCs were resuspended in 50 µl and 100 µl of a mixture composed of acetonitrile:H2O (90:10, v:v) by constant shaking at 1,000 rpm for 10 min at 8 °C and then centrifuged at 16,400g for 5 min to remove insoluble material. The soluble part was placed in the insert of the LC–MS vial.
LC–MS analysis
Metabolomics untargeted analysis was performed using an Ultimate 3000 HPLC system consisting of a degasser, two binary pumps, and autosampler with thermostat, maintained at 8 °C (Thermo Fisher Scientific) coupled to a LTQ Orbitrap XL Hybrid Ion Trap-Orbitrap Mass Spectrometer (Thermo Fisher Scientific). The samples (5 µl) were injected onto a Merck SeQuant ZIC-HILIC column (150 × 1 mm, 3.5 µm), which was maintained thermostatically at 45 °C, and metabolites were eluted at 180 µl min−1 with solvent A composed of water with 0.1% formic acid, and solvent B composed of acetonitrile with 0.1% formic acid. The gradient started from 90% to 25% of B in 15 min, keeping constant for 3 min and returned to starting conditions in 0.1 min, finally by keeping the re-equilibration at 90% of B for 11.9 min. Data were collected in positive ESI ion mode. The mass spectrometer operated in full scan mode from 70 to 1,000 m/z at 60,000 resolution. MS/MS spectra were collected in data-dependent mode via collision induced dissociation (CID) in the ion trap. Samples were analysed in a randomized order. QCs were analysed at the beginning, at the end and every six samples.
Data handling
Generated data were firstly aligned using Compound Discoverer (Thermo Fisher Scientific); signals were extracted and grouped into features (isotopic traces from a single analyte at a particular charge state) using the Metaboprofiler node in Compound discoverer (open source plug-in freely available from OpenMS; https://openms.de/) as described55. Features were then filtered by presence keeping the entities that were present in at least 80% of the samples from the same group. Missing values were imputed using the k-nearest neigbours method or by limit of detection (LoD) (1/5 of the minimum positive value of each variable) according to the percentage of missing values of the feature within the group in MetaboAnalyst v.5 (https://www.metaboanalyst.ca/MetaboAnalyst/home.xhtml)56. Data were autoscaled and log-transformed. Metabolites were annotated by searching their accurate experimental mass against the Ceu Mass Mediator (http://ceumass.eps.uspceu.es/)57 and the resulting data matrix handled by Turboputative (https://proteomics.cnic.es/TurboPutative/)58. Identification of ImP was then confirmed by using the reference standard (Sigma Aldrich 77951) in a subsequent LC–MS/MS analysis following higher-energy collisional dissociation by using 50 eV as collisional energy.
Flow cytometry analysis
For blood samples, single-cell suspensions were stained for 30 min at 4 °C with LIVE/DEAD Fixable Aqua Dead Cell Stain Kit (Life Technologies). After washing with PBS, cells were stained in FACS buffer containing anti-CD16/32 (BioXcell), 3% FBS and 0.05% EDTA with the corresponding antibody cocktail for 30 min on ice. Cells were stained with a cocktail of antibodies against CD45-APCCy7 (Biolegend), CD11b-BV605 (Biolegend), CD11c-BV650 (Biolegend), Ly6C-BV711 (Biolegend), LY6G-APC (BD Biosciences), CD8-PE (eBioscience), CD90-BV785 (BD Biosciences), MHCII-AF700 (Biolegend), B220-PerCP5.5 (Biolegend), SiglecH-FITC (eBioscience), CD4-PeCy7 (Biolegend). In another set of experiments, cells were stained with, CD45-APCCy7 (Biolegend), LY6G-V450 (BD Biosciences), CD11b-ef660 (eBioscience), CD11c-PE (Biolegend), B220-PerCP (Biolegend), CD90-UV805 (Fisher scientific), XCR1-BV785 (Biolegend), CD206-eF450 (Biolegend), MHCII-UV737 (BD Biosciences), F4/80-PerCp5.5 (Biolegend), Rorγt-APC (Biolegend), T-bet-PECF594 (BD Biosciences), Ly6C-BV711 (Biolegend), CD86-PECy7 (Biolegend), FOXP3-FITC (Biolegend), CD4-BV570 (Biolegend). Cells were washed again and resuspended in FACS buffer for data acquisition using an LSRFortessa SORP (Becton Dickinson) or a FACSymphony (Becton Dickinson) flow cytometry equipment and analysed with FlowJo software version 10 (TreeStar). The gating strategies used for these analyses are detailed in Supplementary Fig. 1.
To perform flow cytometry analysis of cells infiltrating the aorta, mice were perfused with 10 ml PBS via cardiac puncture to remove blood contamination from vascular tissue. Aortas were kept in cold Dulbecco’s modified Eagle medium (DMEM) to be digested. Perivascular fat was removed and the thoracic aorta with arch was opened longitudinally and cut into smaller pieces that were incubated for 30 min at 37 °C in a water bath in digestion buffer (Collagenase A (25 mg ml−1), (Roche/Sigma 10103586001), Dispase II (25 mg ml−1), (Roche/Sigma 04942078001), DNase I (250 μg ml−1) (Roche/Sigma 10104159001) elastase (25 μg ml−1) and Libersase TL (0.2 Wünsch units per ml, 5401119001)). After incubation time the digested tissue was mixed by pipetting, filtered through a 70-μm strainer and spinned at 400g 5 min at 4 °C. Single cells were stained with a cocktail of antibodies against CD45-APCCy7 (Biolegend), CD11b-BV605 (Biolegend), CD11c-BV650 (Biolegend), Ly6C-BV711 (Biolegend), LY6G-APC (BD Biosciences), CD8-PE (eBioscience), CD90-BV785 (BD Biosciences), MHCII-AF700 (Biolegend), B220-PerCP5.5 (Biolegend), SiglecH-FITC (eBioscience), CD4-PeCy7 (Biolegend). Depending on the experimental setting, cells were stained with CD45-APCCy7 (Biolegend), LY6G-V450 (BD Biosciences), CD11b-ef660 (eBioscience), CD45-APCCy7 (Biolegend), LY6G-V450 (BD Biosciences), CD11b-ef660 (eBioscience), CD11c-PE (Biolegend), B220-PerCP (Biolegend), CD90-UV805 (Fisher scientific), XCR1-BV785 (Biolegend), CD206-eF450 (Biolegend), MHCII-UV737 (BD Biosciences), F4/80-PerCp5.5 (Biolegend), Rorγt-APC (Biolegend), T-bet-PECF594 (BD Biosciences), Ly6C-BV711 (Biolegend), CD86-PECy7 (Biolegend), FOXP3-FITC (Biolegend), CD4-BV570 (Biolegend), CD31-PE (Biolegend) and VCAM-AF594 (Biotechne). Cells were washed and resuspended in FACS buffer for data acquisition using a LSRFortessa SORP (Becton Dickinson) or a FACSymphony (Becton Dickinson) flow cytometry equipment and analysed with FlowJo software version 10 (TreeStar). Gating strategies for B cells, T cells, TH1 and Treg cells are shown in Supplementary Fig. 2, and those for macrophage subsets are shown in Supplementary Fig. 3.
Study populations
PESA cohort
This study was conducted in a subset of participants (n = 400) from the PESA study59. The PESA-CNIC-Santander (NCT01410318) is an ongoing observational prospective cohort study of 4,184 asymptomatic employees of the Santander Bank in Madrid (from 40 to 54 years of age and free of known CVD at baseline in 2009). In addition to the exclusion criteria followed in the main study2, participants taking antibiotics in the three months prior to the sample collection, with known type 2 diabetes or those treated for diabetes and/or intestinal disorders were excluded. This enabled us to remove possible confounding effects due to the role of ImP in diabetes and insulin resistance15 and the modification of gut microbiota possibly affecting the production of ImP. Subclinical atherosclerosis was assessed by imaging studies including 2D and 3D vascular ultrasonography of carotid and iliofemoral arteries and presence of coronary artery calcium assessed by CT scan, as previously described59. Participants with subclinical atherosclerosis underwent a whole body 18F-FDG PET/MRI study to characterize arterial 18F-FDG uptake and bone marrow metabolic activity, as described20,21. The cardiovascular risk score used included the European Society of Cardiology SCORE (Systematic Coronary Risk Evaluation), which calculates 10-year risk of fatal CVD1. Fasting blood test included biochemistry and determination of hs-CRP. In this study, hypertension was defined as systolic >130 mmHg and/or diastolic >85 mmHg and/or individuals taking antihypertensive drugs. Dyslipidaemia was defined as total cholesterol ≥240 mg dl−1, LDL-cholesterol ≥160 mg dl−1, HDL-cholesterol <40 mg dl−1, or use of lipid-lowering drugs. Anthropometry and bioelectrical impedance analysis assessments were performed during the same appointment for each participant. Height and weight were measured using calibrated equipment (Tanita BC-545N,) with participants wearing underwear and barefoot. BMI was calculated as weight (in kg) divided by height (in metres) squared. Extent of atherosclerosis was defined by a summed ordinal variable that is calculated by the number of affected vascular sites into a sum of total points as follows: (1) carotid atherosclerosis (points: 0, no plaque; 1, 1 plaque; 2, 2 plaques; 3, 3 or more plaques) as estimated by 3D vascular ultrasonography and summed for both left and right carotid artery; (2) femoral atherosclerosis (points: 0, no plaque; 1, 1 plaque; 2, 2 plaques; 3, 3 or more plaques) as estimated by 3D vascular ultrasonography and summed for both left and right femoral artery; (3) presence of calcification in the ascending or descending aorta (points: 0, no; 1, yes); (4) CAC score (points: 0, 0; 1, 0.1–99; 2, 100–399; 3, 400–maximum). For the metabolomic analysis, peripheral blood samples collected after overnight fasting were centrifuged at 2,750g at room temperature for 10 min to obtain plasma that was further aliquoted and stored at −80 °C. For 16S rDNA amplicon gene sequencing analysis, faeces were collected in collection cups and immediately frozen at −80 °C until further analysis. The institutional ethics committee approved the study protocol, and all participants were provided with written informed consent. Characteristics of the participants are listed in Supplementary Tables 1a,b and 3.
IGT cohort
To validate the findings from the PESA study, a subset of the IGT cohort was used (Ethics 560-13). Subject and method design from the validation cohort have been described elsewhere16. In brief, the study population comprises men and women aged 50–64 years from the Gothenburg area (Sweden), recruited on a random basis from the Swedish population register and included based on their glucose status. The applied exclusion criteria included: known diabetes, inflammatory diseases (for example, Crohn′s disease, ulcerative colitis or rheumatic diseases), treatment with steroids or immunomodulatory drugs, cancer (unless relapse free for the preceding five years), cognitive dysfunction, treatment for infectious diseases and with antibiotics in the past three months, inability to understand written and spoken Swedish as well as individuals born outside Sweden. The participants were invited by letter and gave all informed consent. Atherosclerosis was assessed by ultrasound imaging of carotid arteries, using a standardized protocol including a Siemens Acuson S2000 ultrasound scanner, and by presence of coronary artery calcium assessed by CT scan, as previously described16. Systolic blood pressure was measured twice with an automatic device (Omron M10‐IT, Omron Health Care Company) and the mean of the measurements was used. A questionnaire was used to collect detailed information on medication and family history. A venous blood sample (100 ml) was collected from participants after an overnight fast and was used for immediate biochemical analysis of glucose, glycated haemoglobin and total cholesterol. SCORE2 (systematic coronary risk evaluation) was calculated as described1. Body weight, height, waist and hip circumference were measured on calibrated equipment with participants dressed in light clothing without shoes and according to current WHO recommendations. Extent of atherosclerosis was defined by a summed ordinal variable that is calculated by the number of affected vascular sites into a sum of total points as follows: (1) carotid atherosclerosis (points: 0, no plaque; 1, at least 1 plaque at either left or right carotid; 2, plaques at both vessels); (2) CAC score (points: 0, 0; 1, 0.1–99; 2, 100–399; 3, 400–maximum). Characteristics of the participants are listed in Supplementary Table 2a,b.
Targeted metabolomics
Plasma levels of ImP, urocanic acid and histidine were quantified using ultra high-performance liquid chromatography (UHPLC) coupled to tandem mass spectrometry (LC–MS/MS). Analyses were performed in two different laboratories in Spain (PESA cohort) and in Sweden (IGT cohort). Both laboratories have used fully validated LC–MS/MS methods.
The determination of ImP in plasma samples from Apoe−/− mice fed a chow or high-cholesterol diet with and without ImP (400 μg per mouse per day) and/or AGN192403 (30 μg per mouse per day) in the drinking water was carried out by following the method described below for the human study, specifically for the PESA cohort.
Working solutions and standards
For the PESA cohort, individual 1,000 ppm stock solutions of ImP (Sigma Aldrich 77951), urocanic acid (urocanic acid-1,2,3-13C3, Sigma Aldrich, 709638) and histidine (l-histidine-d3 hydrochloride monohydrate, Sigma Aldrich, 791318) were prepared in ultrapure water and stored at −20 °C. Their respective dilutions were then prepared in methanol:ethanol (1:1, v/v) and stored at 4 °C. For the IGT cohort, histidine (histidine-d5 15N3, Cambridge Isotope Lab), ImP and urocanic acid (ImP-13C3 and urocanate-13C3, Astra Zeneca) were prepared in acetonitrile.
Metabolite quantification
For the PESA cohort, 65 µl of methanol:ethanol (1:1, v/v) were added to 50 µl of plasma sample and 35 µl of isotopically labelled internal standards in methanol:ethanol (urocanic acid and histidine). Samples were vortex-mixed for 10 s and then centrifuged at 13,000 rpm for 20 min at 4 °C. One-hundred microlitres of supernatant were taken and transferred to liquid chromatography vials for the analysis. Quantification of the metabolites was performed by using an UHPLC system 1290 Infinity series coupled to a triple quadrupole (QqQ) 6460 MS from Agilent Technologies. In brief, 1 µl of the sample was injected onto an InfinityLab Poroshell 120 HILIC-Z column (2.7 μm, 150 × 2.1 mm, Agilent Technologies) with a flow rate of 0.50 ml min−1. Mobile phase A contained 20 mM ammonium formate in ultrapure water at pH 3, whereas mobile phase B contained 20 mM aqueous ammonium formate at pH 3 in acetonitrile:H2O (9:1, v/v). The initial conditions at time 0 were 100% B, decreasing to 70% at 11.5 min. The gradient was then increased to 100% B at time 12.0 min and held until the total run time of 15 min. Mass spectrometry data were acquired in positive ionization mode. Raw signals for multiple reaction monitoring transitions were checked and peaks corresponding to all the targeted compounds were integrated by MassHunter Quantitative B.10.00 (Agilent Technologies). Multiple reaction monitoring transitions (collision energy, eV) were as follows: 141>123 (10) and 141>81 (26) for ImP; 139>121 (10) and 139>93 (26) for urocanic acid; 142>124 (10) and 142>41 (26) for labelled urocanic acid; 156>110 (10) and 156>83 (30), for histidine; and 159>113 (10) and 159>86 (30) for labelled histidine. Quantification of ImP concentration was performed by generating a standard curve with known concentrations of this metabolite. Histidine and urocanic acid were instead quantified by using internal standards added to plasma samples as stated above. Metabolite standards were analysed alongside plasma samples using the LC–MS/MS method. Dilution of the plasma during sample preparation was also taken into account for quantification.
For the IGT cohort, determination of ImP, urocanate and histidine levels in plasma were performed as described previously with minor modifications15. In brief, 25 µl of plasma samples were extracted using 6 volumes of acetonitrile containing 100 nM of internal standards before drying the samples under a flow of nitrogen. Then, the samples were reconstituted with 5% HCl (37%) in 1-butanol, subjected to n-butyl ester derivatization and finally reconstituted in 150 µl water:acetonitrile (9:1). ImP, urocanate and histidine levels were determined by UHPLC–MS/MS analysis using multiple reaction monitoring of the transitions 197.2>81.2, 195>93 and 213.2>110.1, respectively. For the internal standards, the transitions 200.2>82.0, 198.2>95.0 and 220.3>118.1 were used. The analytical system consisted of an Acquity UPLC I-class system coupled to a Xevo TQ-XS triple quadrupole mass spectrometer (Waters). Sample volume (2 µl) was injected onto a C18 BEH column (2.1 × 50 mm with 1.7-µm particles, Waters) and separated using a gradient consisting of water with 0.1% formic acid (A-phase) and acetonitrile with 0.1% formic acid (B-phase). Quantifications were performed using a standard curve with known concentrations of ImP, urocanate and histidine.
DNA extraction, 16S rDNA amplicon sequencing and microbiota data analysis
For mice caecum samples, total DNA was extracted using the MasterPure Complete DNA & RNA Purification Kit (Epicentre) with some modifications, as previously described60. DNA concentrations were normalized using a Qubit 2.0 Fluorometer (Life Technology) and specific amplicon of the 16S rDNA gene (V3–V4 region) was generated following the 16S Metagenomic Sequencing Library Preparation Illumina protocol. The multiplexing step was performed using Nextera XT Index Kit (Illumina) and PCR amplicon-product was checked on a bioanalyzer DNA 1000 chip (Agilent Technologies). The samples were pooled in equimolar amounts and sequenced with the MiSeq Reagent kit v.3, on a MiSeq Illumina platform (FISABIO sequencing service).
For human samples, faecal DNA was extracted using a commercially available kit (E.Z.N.A stool DNA kit, Omega Biotek)61. Next, amplicon library of the V4 region within the 16S rDNA gene were generated and both ends of the fragments were sequenced using an Illumina MiSeq by the Microbiome Core of the University of Michigan62.
In both studies, to rule out and control for potential reagent contamination, the reagents for DNA extraction and PCR amplification were also sequenced as controls. For data analysis of microbiota from mice and humans, the paired-end sequences were curated, binned into operational taxonomic units at >97% identity level, and annotated with SILVA release v.132 using DADA263 for mice data and v.138 and RDP version 18 databases using Mothur (v.1.40.5)62,64 as previously described61 for human data. Spearman rank correlation coefficients between ImP level and bacterial abundance were determined using otu.association function of Mothur62,64.
Dietary pattern assessment
Dietary intake data were collected via semi-quantitative 136-item food-frequency questionnaire validated for the Spanish population65. Foods reported during the dietary assessment were classified into 44 food groups based on the similarity of nutrients profile, averaged over the days to derive habitual intake and normalized by the BMI of each participant. Next, a PCA was performed in SPSS V.23.0 (SPSS) to identify common underlying dimensions (factors or patterns) of food consumption by deriving factor loadings for each predefined food group. Factors were subsequently rotated using a Varimax procedure to maintain uncorrelated factors. Analysis of eigenvalues, scree plot, and the interpretability of the factor solution were used to support a final decision on retaining a 5-factor solution, where each factor had an eigenvalue >0.3. According to the observed factor loadings of the food groups, we named the first factor Mediterranean dietary pattern (enriched in vegetables, whole grains, and fish), the second and third factors as Breakfast dietary patterns (Breakfast1: enriched in cereals, tea, low fat dairy, and Breakfast2: mainly composed of bread, egg and coffee), and the fourth factor the Western dietary pattern (enriched in red meat, sugar, snacks and refined grains) and the fifth factor the Social dietary pattern (enriched in soft drinks and spirits).
scRNA-seq
Apoe−/− 8-week-old male mice were treated in the drinking water with ImP (400 μg per mouse per day) for 4 or 8 weeks. Aortas were collected and digested as described above. To obtain enough cell numbers, three aortas per condition were pooled. Each sample was labelled with a cell multiplexing oligo (CMO) using the CMO labelling for scRNA-seq Protocol from 10X Genomics. Cells labelled with CMOs were washed, labelled with SytoxGreen and Hoechst to ensure cell viability, and live cells were sorted with a FACs Aria cell sorter. Samples were pooled and scRNA-seq was performed following the Chromium Next GEM Single Cell 3′ v.3.1 with feature barcode technology for cell multiplexing protocol (10x Genomics). In brief, cells were first counted and checked their viability using the Countess 3 cell counter (Thermofisher). Next, cells were loaded onto a 10X Genomics chip of the Chromium Controller (10X Genomics). After cDNA amplification, gene expression and CMO libraries were generated and sequenced using an Illumina NextSeq 2000 sequencer.
Raw sequencing data processing was performed from FASTQ file from each port using Cell Ranger (v.6.1.2) with default parameters and the mm10 (GRCm38.p6) mouse genome reference provided by 10X Genomics. Obtained raw unique molecular identifier (UMI) count matrices of valid barcoded cells for each port were loaded into R (v.4.1.2) for further analyses using Bioconductor packages66 and Seurat (v.4.0.6)67. First, cells were filtered out according to the total number of UMI counts (≤1,000 and ≥50,000), total number of detected genes (≤200 and ≥6,000), and percentage of mitochondrial UMI counts (≥7.5%). Then, resulted cells were demultiplexed using the cellhashR R package (v.1.0.2)68 using htodemux, bff_cluster, gmm_demux, multiseq, and dropletutils methods. Consensus classification was used for further analyses. Once the final set of cells was obtained, transcriptional expression values were normalized to total UMI counts per cell multiplied by a scaling factor of 10,000 and natural log-transformed (NormalizeData function). Highly variable genes were defined using the VST method as implemented in Seurat setting. A total of 2,000 highly variable genes and PCA modelling was used to reduce this dimensional space after scaling log-transformed expression values. In this step, variability associated with total number of counts was regressed out using the ScaleData function with linear models. Elbow plot method was used to determine the number of principal components for downstream analyses (25 principal components). Then, cells were clustered using the Louvain algorithm and visualized using the uniform manifold approximation and projection for dimension reduction (UMAP) algorithm with the first 25 principal components as input. Main clusters were identified by using known markers and computing differentially expressed genes with Wilcoxon rank sum test using the presto R package (v.1.0.0) (Extended Data Fig. 4). Cell proportions were calculated for each condition in every cell population, and a two-proportions Z-test using the prop.test R function was used to determine significance.
Differential expression analyses between conditions were independently performed on every cell population comparing ImP vs control for each timepoint (4 or 8 weeks) using the MAST R package (v.1.20.0). Genes were ranked according to log fold changes, and resulting ranks were used as input for the fgsea R package along with the Hallmark gene sets from the Molecular Signature Data Base (MSigDB; https://www.gsea-msigdb.org/gsea/msigdb). In order to identify specific cell subpopulations within every general cell type, each population was separated and independently analysed using the same workflow explained above. Subclusters were identified by using known markers and calculating differentially expressed genes with the presto R package. Finally, an overrepresentation analysis considering gene markers for every identified subcluster was performed along with the GO database (https://www.geneontology.org/) in order to interpret the transcriptional state of each subpopulation.
Cell lines
MAECs were isolated from mouse thoracic aortas as described69. Cells were cultured in Medium 199 (Gibco, Invitrogen Life Technologies) + 20% fetal bovine serum + penicillin/streptomycin 2 mM + glutamine 2 mM + HEPES 10 mM + endothelial cell growth supplement 30 μg ml−1 + Heparin 100 mg ml−1, all from Sigma Aldrich, under 5% CO2 at 37 °C. MEF cell lines were isolated from 13.5 days post coitum from embryos using standard protocol. Each embryo was dissected into 10 ml of sterile PBS, voided of its internal organs, head, and legs. After 30 min incubation with gentle shaking at 37 °C with 5 ml 0.1% trypsin, cells were plated in two 100 mm dishes and incubated for 24–48 h. To establish the immortalized MEF lines, early passage MEFs were seeded in 60 mm plates and infected with 105 IU ml−1 packaged retrovirus carrying the human papillomavirus (HPV) 16 E6/E7 genes. Selection was performed with 400 μg ml−1 of G418 during 10 days.
L929 cell line (ATCC CCL-1TM) used for production of the M-CSF supernatant, was grown on 175 cm2 cell culture flasks (Stemcell) and resuspended in RPMI 1640 (Sigma) supplemented with 10% heat-inactivated fetal calf serum (FCS, Sigma), 1 mM pyruvate (Lonza), 100 µM non-essential aminoacids (Thermo Fisher Scientific), 2 mM l-glutamine, 100 U ml−1 penicillin and 100 µg ml−1 streptomycin (all three from Lonza), herein called R10. Supernatants were obtained by filtering 15-days long cultures through 0.22 μm Stericup Filter units (Merck Millipore) and were used to subsequently supplement the medium for the generation of BMDMs.
Mouse BMDMs were generated as described70, with some modifications. Bone marrow cells from WT C57BL/6J mice were cultured in RPMI 1640 supplemented with 30% M-CSF obtained from L929 cell line and 10% FBS, 100 μg ml−1 penicillin, 100 μg ml−1 streptomycin, 10 mM HEPES, 1 nM sodium pyruvate (all from Gibco) during 5 days in sterile, but not tissue culture-treated, 10-cm Petri dishes.
Bulk RNA-seq
Cultured BMDMs, MEFs and MAECs were plated in equal number and rested overnight. Specifically, for BMDMs and MEFs, 6 × 10⁵ cells per well were plated in 6-well plates (2,000 µl final volume, Corning), and for MAECs 1 × 10⁵ cells per well were plated in p24 (1,000 µl final volume, Corning). Cells were treated in vitro with or without ImP (10 μg ml−1) for 1 or 2 h. Total RNA was isolated from BMDMs, MEFs (QIAamp DNA Mini Kit) and MAECs (miRNeasy Micro Kit). Bulk RNA-seq experiments were performed in the Genomics Unit of the CNIC. For the BMDM and MEF samples, RNA-seq libraries were prepared using the NEBNext Ultra II Directional RNA Library preparation kit (New England Biolabs) according to the manufacturer’s instructions. For MAECs samples, libraries were prepared using the NEBNext Single Cell/Low Input RNA Library Prep Kit for Illumina (New England Biolabs) according to the manufacturer’s instructions. All libraries were sequenced in a Nextseq 2000 (Illumina). FastQ files for each sample were obtained using bcl2fastq v.2 2.20 software (Illumina). The number of reads per sample was between 11 and 21 million. Reads were preprocessed according to the type of library preparation using cutadapt to trim adapters and FastQC to assess read quality. In the case of directional RNA-seq reads (BMDMs and MEFs), Illumina adaptor sequences were removed, and only reads longer than 30 bp were kept as valid. For MAECs, in addition to Illumina adaptor sequences, adaptors from the low input NEBNext protocol were detected and removed and only reads longer than 30 bp were kept as valid. Resulting reads were mapped to the reference transcriptome GRCm38.102 using STAR71 and gene expression levels were estimated using RSEM72. Further analyses were performed in R (v.4.3.2). In brief, counts per million were calculated, and size factors for inter-sample normalization were determined using the trimmed mean of M values method. Then, log-normalized data considering only genes with ≥20 counts in 3 samples were used for differential expression analysis, making all possible comparisons within the same cell type using the DESeq2 R package73. Gene-set enrichment analysis was performed using the fgsea R package comparing 1 h and 2 h after ImP stimulation with 0 h (unstimulated) within each cell type. Genes were ranked in each comparison according to logFC, and fgsea was used along with the Hallmark gene sets from the Molecular Signature Data Base (MSigDB; https://www.gsea-msigdb.org/gsea/msigdb). Finally, normalized enrichment scores of significant selected pathways were represented as a heat map using the ComplexHeatmap R package74.
Proteomics and phosphoproteomics by isobaric labelling
Cultured BMDMs and MEFs were plated at 1 × 10⁶ cells per well in 6-well plates (Corning), 2 ml final volume, and rested overnight in RPMI 1% medium. Cells were treated in vitro with or without ImP (10 μM) and co-incubated or not with AGN192403 (1 μM, I1R antagonist) for 180 min. Cell culture monolayers were washed with PBS, and protein extracts were obtained with lysis buffer (50 mM Tris-HCl pH 7.6, 2% SDS, 10 mM Tris-(2-carboxyethyl)phosphine (TCEP)) containing protease and phosphatase inhibitor cocktails (Complete Mini EDTA-free and phosSTOP, Roche). Samples were boiled for 5 min and incubated for 20 min at room temperature for solubilization and reduction of the proteins, and after centrifugation at 15,000g for 15 min, supernatants were recovered, and protein concentration was determined by using a RC DC Protein Assay Kit (BioRad Laboratories).
Proteome and phosphoproteome analyses were carried out using 18-plex isobaric TMT labelling as described75. Statistical analysis of quantitative data was performed using iSanXoT76, and the comparative analysis between conditions was performed using the normalized values \({X}_{p}^{m}\) and \({X}_{q}^{m}\), which represent the binary logarithm of the ratio between the abundance in sample m and its control for peptide p and protein q, respectively. GSEA77 using Xp values of peptides was used to evaluate the phosphorylation levels in proteins of the mTOR signalling pathway among conditions (that is, cells stimulated with ImP versus unstimulated). In addition, a Wilcoxon signed rank test was performed using paired phosphopeptide abundance Xp values to determine the effects of AGN192403 in the phosphorylation levels of the mTOR pathway among cells treated with ImP and co-incubated or not with AGN192403.
p-S6 staining by flow cytometry
Cultured MEFs and BMDMs were plated in equal numbers (6 × 10⁵ cells per well) in 6-well plates (2,000 µl final volume, Corning) and rested overnight. Cells were treated in vitro with or without ImP (10 μg ml−1) co-incubated with Rapamycin (10 nM), AGN192403 (1 μM, I1R antagonist), Idazoxan (0.29 nM, imidazoline receptor and α2-adrenergic antagonist) or Yohimbine (0.28 nM, α2 antagonist). After 24 h, cells were collected and labelled with p-S6-PE antibody (Cell Signalling 5316) according to the manufacturer protocol and the activation was measured by flow cytometry.
Peritoneal macrophages collection
Peritoneum cells were isolated by lavage with 5 ml of cold PBS. Cells were plated and non-adherent cells were washed with PBS 1 h later. Adherent cells were defined as peritoneal macrophages, which were routinely controlled by flow cytometry. p-S6 staining by flow cytometry was assessed as described above.
TNF measurement
Cultured MEFs and BMDMs were plated in equal numbers (1 × 10⁵ cells per well) in 96-well plates (200 µl final volume, Corning) and rested overnight. Cells were treated in vitro with and without ImP (10 μM) and co-incubated with Rapamycin (10 nM), AGN192403 (1 μM, I1R antagonist), Idazoxan (0.29 nM, imidazoline receptor and α2 antagonist) or Yohimbine (2.8 nM, α2 antagonist). After 24 h, supernatant was collected, and TNF concentration was quantified with mouse TNF DuoSet ELISA (DY410) according to the manufacturer’s instructions.
MCP1 measurement
Cultured MEFs were plated (1 × 10⁵ cells per well) in 96-well plates (200 µl final volume, Corning) and rested overnight. Cells were treated in vitro with and without ImP (10 μM). After 24 h supernatant was collected, and MCP1 concentration was quantified with mouse CCL2/JE/MCP1 DuoSet ELISA (DY479) according to the manufacturer’s instructions.
Transwell
Migration of circulating monocytes induced by MEFs was assessed in a transwell migration assay. Circulating monocytes from 8-week-old Apoe−/− male mice were sorted (CD3−B220−NK1.1−LY6G−CD49−SIGLECF−CD45+CD11B+Ly6C+/−). Initially, MEFs were placed on the lower chamber of the transwell with DMEM 1% FBS. Sorted monocytes were placed onto the upper chamber of the transwell with RPMI 1% FBS. MEFs were stimulated with ImP 10 μM. After 24 h, the medium under transwell was collected and cells in the supernatant were quantified using LSRFortessa SORP (Becton Dickinson).
Serum cytokines measure
Blood was collected as described above. Amount of TNF and IFNγ in the serum was measured according to the manufacturer protocol using mouse TNF DuoSet ELISA (DY410) and mouse IFNγ DuoSet ELISA (DY485), respectively.
ImP treatment in grafted mice
Ldlr−/− CD45.1 mice were lethally irradiated with two doses of 550 rad (5.5 Gy), separated by at least 3 h, for a total radiation dose of 1,100 rad, followed by intravenous injection of 2 × 10⁶ bone marrow cells from CD45.2+ Lyz2ΔRaptor or control Raptorfl/fl littermates. In parallel experiments, 2 × 10⁶ α2-adrenoceptor cells from Rag1−/− or control C57BL/6J wild-type mice were transferred. In another set of experiments, Ldlr−/− CD45.1 mice were lethally irradiated as described above followed by intravenous injection of 2 × 10⁶ bone marrow cells from CD45.2+ Lyz2ΔNisch or control Nischfl/fl littermates. Grafted mice were injected with 25 μg g−1 of cefovecin subcutaneously to prevent infection upon bone marrow graft. Upon reconstitution of bone marrow after 45 days, mice were treated or not with ImP (400 μg per mouse per day, Biogen Cientifica BA-F-3185.0001) for 12 weeks in the drinking water.
I1R siRNA silencing
I1R silencing in vitro was performed using Nisch siRNA (Santa Cruz sc-61202), a pool of 3 target-specific 19–25 nt siRNAs designed to knock down Nisch gene expression or control siRNA (Santa Cruz sc-36869) consisting of a scrambled sequence conjugated to 10–20 fluorescein that does not lead to the specific degradation of any cellular mRNA. Cultured MEFs were plated (2 × 10⁵ cells per well) in a 6-well tissue culture plate in 2 ml of antibiotic-free normal growth medium supplemented with FBS. After 24 h, cells were washed with siRNA Transfection Medium (Santa Cruz sc-3686860) and siRNA duplex solution (A + B) was added after mixing by pipetting and incubating the mixed solution for 30 min at room temperature (A: 60 pmol siRNA into 100 µl siRNA Transfection Medium; B: 6 µl of siRNA Transfection Reagent (Santa Cruz sc-29528) into 100 µl siRNA Transfection Medium). MEFs were incubated with the mixed solution. After 5 h transfection, medium was removed and 2 ml of RMPI 10% FBS with antibiotics was added. After 24 h, cells were treated in vitro with and without ImP (10 μM) and co-incubated or not with AGN192403 (1 μM, I1R antagonist).
Quantitative PCR with reverse transcription
To determine Nisch expression, spleen cells were sorted as CD45+CD11b+ and CD45+CD3+ cells, and RNA extracted with the RNeasy Mini Kit and reverse transcribed using the High-Capacity cDNA Reverse Transcription Kit with random hexamers following manufacturer’s instructions. Quantitative PCR was performed using the GoTaq qPCR Master Mix in a 7900HT Fast Real-Time PCR System. The sequence of primers used for qPCR were: Nisch sense 5′-TATGTTGTGGCACAGAAGATGG-3′; anti-sense 5′-TTCAGGCAATGGATAGTGGAT-3′; Gapdh sense 5’-TGAAGCAGGCATCTGAGGG-3′; anti-sense 5’-CGAAGGTGGAAGAGTGGGAG-3′.
Statistics
Data analysis was carried out using GraphPad Prism software v.9.0 (GraphPad Software) and Stata version 18 (StataCorp). Variables were presented as mean ± s.e.m or mean ± s.d. unless otherwise stated. The Kolmogorov–Smirnov test and Shapiro–Wilk normality test were used to determine the normal distribution of samples. Nominal variables were presented as percentages and frequencies. Comparisons between two groups were performed using two-tailed unpaired Student’s t-tests (normal distribution) or Mann–Whitney U-tests (non-normal distribution) for continuous variables or Fisher exact test for categorical variables. Unless otherwise stated, comparisons across multiple groups were assessed using one-way ANOVA (normal distribution) followed by Tukey’s post hoc test, or Kruskal–Wallis test (non-normal distribution) followed by Dunn’s test as indicated in each figure legend. Continuous variables were compared across tertiles of ImP by ANOVA or non-parametric Kruskall Wallis tests as appropriate, whereas nominal variables by applying the Cohran–Armitage test (dichotomous variables) and the Jonckheere–Terpstra test (ordinal variable) for trend. Only significant differences are indicated. For untargeted metabolomics data, P values were corrected with a Benjamini–Hochberg post hoc method (q = 0.05) and supervised (PLS-DA) analyses were applied to select the variables responsible for the separation showed by models in MetaboAnalyst (https://www.metaboanalyst.ca/MetaboAnalyst/home.xhtml)56 (Fig. 1b,c). The models were statistically validated by cross-validation tool, using the leave-1/3-out approach to exclude model overfitting.
For the human cohorts (PESA and IGT), no sample size calculation was conducted, as samples were retrospectively collected from observational studies. Instead, sample sizes were determined based on the availability of well-characterized patients with complete clinical, imaging, and biosamples from ongoing prospective observational studies. The cohorts were assembled with the goal of maximizing biological and phenotypic depth rather than targeting a predefined effect size. The inclusion of two independent cohorts with complementary phenotypes enabled replication and validation across datasets. Post hoc power considerations indicated that the sample size of the derivation cohort (PESA cohort, n = 400) was adequately powered at the 0.85 level to detect a minimum 5 nM difference in ImP levels between the group of individuals without atherosclerosis and individuals with atherosclerosis. A ratio of 1:3 between patients without and with atherosclerosis was selected to reflect the distribution of atherosclerosis in the PESA cohort, and measures of dispersion (s.d.) were derived from the group of participants without atherosclerosis in the PESA cohort. Respectively, the IGT cohort was adequately sized to detect with 0.85 power a difference of 2 nM in ImP levels between participants without and with atherosclerosis. Power considerations were based on the Mann–Whitney test for two independent groups. Type I error was prespecified at 0.05 for power calculations. Power analysis was performed with G*Power 3.1.9.6 (University of Kiel, Germany). Restricted cubic splines (natural splines, RCS) with three knots across ImP distribution were applied to produce dose–response curves and to flexibly model the potential non-linear association of continuous ImP with the main endpoints, as previously described78,79. In both cohorts, the three knots for RCS were fixed at the 10th, 50th and 90th percentile of the ImP distribution. Number of knots was selected on the basis of improvement in log likelihood among regression models with 3- or 4-knot RCS. To enhance visual clarity, plots with RCS were truncated at values exceeding the 95th percentile of the ImP distribution. We evaluated the non-linear relationships of ImP with log odds ratio of the main atherosclerosis outcomes by examining (Wald test) the non-linear terms (RCS)80. Dose–response curves in both cohorts were controlled for a set of confounders, constructed by combining LASSO regression and variables with biological plausibility. LASSO for logistic regression was used for multivariable model selection with respect to the outcome presence of atherosclerosis. Adaptive LASSO with cross-validation was employed to select the value of the LASSO penalty parameter lambda81. Adjusted differences in levels of ImP across groups of interest were estimated by multivariable linear regression analysis. To evaluate the association between ImP levels and the presence and activity of atherosclerosis within the PESA cohort multinomial logistic regression was performed and the model was adjusted on a set of confounders (age, sex, smoking status, fasting glucose, hs-CRP and haemoglobin concentration) based on previous evidence21. The proportional odds assumption was tested with the Brant Wald test. Correlation analysis of ImP, atherosclerosis traits and risk factors, gut microbiome and dietary patterns was investigated using non-parametric Spearman’s test and the resulting P values corrected with a Benjamini–Hochberg post hoc method (q = 0.05). Finally, the discriminatory capability of ImP for prevalence of subclinical or active atherosclerosis on top of traditional risk factors, including LDL-cholesterol and hs-CRP, was assessed by comparing area under the curve from corresponding receiver operating characteristic analysis. Areas under the curve were compared using the DeLong test82. Bootstrapping with 1,000 replicates was used to derive 95% bias-corrected confidence interval. All tests were two-tailed and the level of statistical significance was pre-specified at P < 0.05.
Reporting summary
Further information on research design is available in the Nature Portfolio Reporting Summary linked to this article.
Data availability
Metabolomics data are deposited in the Metabolomics workbench (ST003928, ST003929, ST003932 and ST003938). The bulk RNA-seq and scRNA-seq data generated in this study are available in the NCBI GEO database under BioProject IDs GSE297831 and GSE298392, respectively. The proteomics and phosphoproteomics data have been deposited to the ProteomeXchange Consortium via the PRIDE partner repository with the dataset identifier PXD063955. Source data are provided with this paper.
Change history
05 November 2025
In the originally published version of this article, some of the source data contained a column with pseudonymized patient identification numbers. For privacy reasons, and in accordance with data protection requirements, this file has been replaced with an updated version in which the pseudonymized ID column has been removed, ensuring the data is now fully anonymized. We would like to emphasize that this correction does not affect the results, analyses, or conclusions of the study.
References
SCORE2 working group and ESC Cardiovascular risk collaboration. SCORE2 risk prediction algorithms: new models to estimate 10-year risk of cardiovascular disease in Europe. Eur. Heart J. 42, 2439–2454 (2021).
Fernández-Friera, L. et al. Prevalence, vascular distribution, and multiterritorial extent of subclinical atherosclerosis in a middle-aged cohort. Circulation 131, 2104–2113 (2015).
Libby, P. The changing landscape of atherosclerosis. Nature 592, 524–533 (2021).
Brandts, J. & Ray, K. K. Novel and future lipid-modulating therapies for the prevention of cardiovascular disease. Nat. Rev. Cardiol. 20, 600–616 (2023).
Ridker, P. M. et al. Antiinflammatory therapy with canakinumab for atherosclerotic disease. N. Engl. J. Med. 377, 1119–1131 (2017).
Nelson, K., Fuster, V. & Ridker, P. M. Low-dose colchicine for secondary prevention of coronary artery disease. J. Am. Coll. Cardiol. 82, 648–660 (2023).
Sabatine, M. S. et al. Evolocumab and clinical outcomes in patients with cardiovascular disease. N. Engl. J. Med. 376, 1713–1722 (2017).
Kaasenbrood, L. et al. Distribution of estimated 10-year risk of recurrent vascular events and residual risk in a secondary prevention population. Circulation 134, 1419–1429 (2016).
Chakaroun, R. M., Olsson, L. M. & Bäckhed, F. The potential of tailoring the gut microbiome to prevent and treat cardiometabolic disease. Nat. Rev. Cardiol. 20, 217–235 (2023).
Nemet, I. et al. Atlas of gut microbe-derived products from aromatic amino acids and risk of cardiovascular morbidity and mortality. Eur. Heart J. 44, 3085–3096 (2023).
Witkowski, M., Weeks, T. L. & Hazen, S. L. Gut microbiota and cardiovascular disease. Circ. Res. 127, 553–570 (2020).
Nemet, I. et al. A cardiovascular disease-linked gut microbial metabolite acts via adrenergic receptors. Cell 180, 862–877.e22 (2020).
Martínez-López, M. et al. Microbiota sensing by Mincle–Syk axis in dendritic cells regulates interleukin-17 and -22 production and promotes intestinal barrier integrity. Immunity 50, 446–461.e9 (2019).
Wang, Z. et al. Gut flora metabolism of phosphatidylcholine promotes cardiovascular disease. Nature 472, 57–63 (2011).
Koh, A. et al. Microbially produced imidazole propionate impairs insulin signaling through mTORC1. Cell 175, 947–961.e17 (2018).
Royer, P. et al. Plasma proteomics for prediction of subclinical coronary artery calcifications in primary prevention. Am. Heart J. 271, 55–67 (2024).
Molinaro, A. et al. Imidazole propionate is increased in diabetes and associated with dietary patterns and altered microbial ecology. Nat. Commun. 11, 5881 (2020).
Koren, O. et al. Human oral, gut, and plaque microbiota in patients with atherosclerosis. Proc. Natl Acad. Sci. 108, 4592–4598 (2011).
Trøseid, M., Andersen, G. Ø., Broch, K. & Hov, J. R. The gut microbiome in coronary artery disease and heart failure: current knowledge and future directions. eBioMedicine 52, 102649 (2020).
Fernández-Friera, L. et al. Vascular inflammation in subclinical atherosclerosis detected by hybrid PET/MRI. J. Am. Coll. Cardiol. 73, 1371–1382 (2019).
Devesa, A. et al. Bone marrow activation in response to metabolic syndrome and early atherosclerosis. Eur. Heart J. 43, 1809–1828 (2022).
Ma, J., Luo, J., Sun, Y. & Zhao, Z. Cytokines associated with immune response in atherosclerosis. Am. J. Transl. Res. 14, 6424–6444 (2022).
Gold, E. S. et al. ATF3 protects against atherosclerosis by suppressing 25-hydroxycholesterol–induced lipid body formation. J. Exp. Med. 209, 807–817 (2012).
Wculek, S. K., Dunphy, G., Heras-Murillo, I., Mastrangelo, A. & Sancho, D. Metabolism of tissue macrophages in homeostasis and pathology. Cell. Mol. Immunol. 19, 384–408 (2022).
Chen, J. Y., Cortes, C. & Ferreira, V. P. Properdin: a multifaceted molecule involved in inflammation and diseases. Mol. Immunol. 102, 58–72 (2018).
Kiss, M. G. & Binder, C. J. The multifaceted impact of complement on atherosclerosis. Atherosclerosis 351, 29–40 (2022).
Kan, H. et al. Single-cell transcriptome analysis reveals cellular heterogeneity in the ascending aortas of normal and high-fat diet-fed mice. Exp. Mol. Med. 53, 1379–1389 (2021).
Zhao, G. et al. Single-cell transcriptomics reveals endothelial plasticity during diabetic atherogenesis. Front. Cell Dev. Biol. 9, 689469 (2021).
Gocheva, V., Chen, X., Peters, C., Reinheckel, T. & Joyce, J. A. Deletion of cathepsin H perturbs angiogenic switching, vascularization and growth of tumors in a mouse model of pancreatic islet cell cancer. Biol. Chem. 391, 937–945 (2010).
Shih, S.-C. et al. The L6 protein TM4SF1 is critical for endothelial cell function and tumor angiogenesis. Cancer Res. 69, 3272–3277 (2009).
Schneller, D. et al. Cytokine-like 1 is a novel proangiogenic factor secreted by and mediating functions of endothelial progenitor cells. Circ. Res. 124, 243–255 (2019).
Dyer, L. A., Pi, X. & Patterson, C. The role of BMPs in endothelial cell function and dysfunction. Trends Endocrinol. Metab. 25, 472–480 (2014).
Aiello, R. J. et al. Monocyte chemoattractant protein-1 accelerates atherosclerosis in apolipoprotein E-deficient mice. Arterioscler. Thromb. Vasc. Biol. 19, 1518–1525 (1999).
Wang, L., Lawrence, J. C., Sturgill, T. W. & Harris, T. E. Mammalian target of rapamycin complex 1 (mTORC1) activity is associated with phosphorylation of raptor by mTOR. J. Biol. Chem. 284, 14693–14697 (2009).
Bousquet, P., Hudson, A., García-Sevilla, J. A. & Li, J.-X. Imidazoline receptor system: the past, the present, and the future. Pharmacol. Rev. 72, 50–79 (2020).
Head, G. A. & Mayorov, D. N. Imidazoline receptors, novel agents and therapeutic potential. Cardiovasc. Hematol. Agents Med. Chem. 4, 17–32 (2006).
Zhang, X. et al. High-protein diets increase cardiovascular risk by activating macrophage mTOR to suppress mitophagy. Nat. Metab. 2, 110–125 (2020).
Molinaro, A. et al. Microbially produced imidazole propionate is associated with heart failure and mortality. JACC Heart Fail. 11, 810–821 (2023).
Zhu, W. et al. Gut microbial metabolite TMAO enhances platelet hyperreactivity and thrombosis risk. Cell 165, 111–124 (2016).
Wang, Z. et al. Gut microbiota, circulating inflammatory markers and metabolites, and carotid artery atherosclerosis in HIV infection. Microbiome 11, 119 (2023).
van Son, J. et al. Plasma imidazole propionate is positively correlated with blood pressure in overweight and obese humans. Nutrients 13, 2706 (2021).
Trøseid, M. et al. Gut microbiota alterations and circulating imidazole propionate levels are associated with obstructive coronary artery disease in people with HIV. J. Infect. Dis. 229, 898–907 (2024).
Nageswaran, V. et al. Gut microbial metabolite imidazole propionate impairs endothelial cell function and promotes the development of atherosclerosis. Arterioscler. Thromb. Vasc. Biol. 45, 823–839 (2025).
Wüst, R. C. I. et al. Emerging magnetic resonance imaging techniques for atherosclerosis imaging. Arterioscler. Thromb. Vasc. Biol. 39, 841–849 (2019).
Gimbrone, M. A. & García-Cardeña, G. Endothelial cell dysfunction and the pathobiology of atherosclerosis. Circ. Res. 118, 620–636 (2016).
Roy, P., Orecchioni, M. & Ley, K. How the immune system shapes atherosclerosis: roles of innate and adaptive immunity. Nat. Rev. Immunol. 22, 251–265 (2022).
Finn, A. V., Nakano, M., Narula, J., Kolodgie, F. D. & Virmani, R. Concept of vulnerable/unstable plaque. Arterioscler. Thromb. Vasc. Biol. 30, 1282–1292 (2010).
Wolf, D. & Ley, K. Immunity and inflammation in atherosclerosis. Circ. Res. 124, 315–327 (2019).
Zhang, X. et al. Identification of a leucine-mediated threshold effect governing macrophage mTOR signalling and cardiovascular risk. Nat. Metab. 6, 359–377 (2024).
Lloyd-Jones, D. M. et al. 2017 focused update of the 2016 ACC expert consensus decision pathway on the role of non-statin therapies for LDL-cholesterol lowering in the management of atherosclerotic cardiovascular disease risk: a report of the American College of Cardiology Task Force on Expert Consensus Decision Pathways. J. Am. Coll. Cardiol. 70, 1785–1822 (2017).
Gupta, A. et al. Adverse events associated with unblinded, but not with blinded, statin therapy in the Anglo-Scandinavian Cardiac Outcomes Trial—Lipid-Lowering Arm (ASCOT-LLA): a randomised double-blind placebo-controlled trial and its non-randomised non-blind extension phase. Lancet 389, 2473–2481 (2017).
Rakoff-Nahoum, S., Paglino, J., Eslami-Varzaneh, F., Edberg, S. & Medzhitov, R. Recognition of commensal microflora by toll-like receptors is required for intestinal homeostasis. Cell 118, 229–241 (2004).
Centa, M., Ketelhuth, D. F. J., Malin, S. & Gisterå, A. Quantification of atherosclerosis in mice. J. Vis. Exp. https://doi.org/10.3791/59828 (2019).
Mastrangelo, A. et al. Insulin resistance in prepubertal obese children correlates with sex-dependent early onset metabolomic alterations. Int. J. Obes. 40, 1494–1502 (2016).
Lorenzo, C. et al. ALDH4A1 is an atherosclerosis auto-antigen targeted by protective antibodies. Nature 589, 287–292 (2021).
Pang, Z. et al. Using MetaboAnalyst 5.0 for LC–HRMS spectra processing, multi-omics integration and covariate adjustment of global metabolomics data. Nat. Protoc. 17, 1735–1761 (2022).
Gil-de-la-Fuente, A. et al. CEU Mass Mediator 3.0: a metabolite annotation tool. J. Proteome Res. 18, 797–802 (2019).
Barrero-Rodríguez, R. et al. TurboPutative: a web server for data handling and metabolite classification in untargeted metabolomics. Front. Mol. Biosci. 9, 952149 (2022).
Fernández-Ortiz, A. et al. The Progression and Early detection of Subclinical Atherosclerosis (PESA) study: rationale and design. Am. Heart J. 166, 990–998 (2013).
Sanguinetti, E. et al. Microbiome-metabolome signatures in mice genetically prone to develop dementia, fed a normal or fatty diet. Sci. Rep. 8, 4907 (2018).
Caruso, R., Ono, M., Bunker, M. E., Núñez, G. & Inohara, N. Dynamic and asymmetric changes of the microbial communities after cohousing in laboratory mice. Cell Rep. 27, 3401–3412.e3 (2019).
Kozich, J. J., Westcott, S. L., Baxter, N. T., Highlander, S. K. & Schloss, P. D. Development of a dual-index sequencing strategy and curation pipeline for analyzing amplicon sequence data on the MiSeq Illumina sequencing platform. Appl. Environ. Microbiol. 79, 5112–5120 (2013).
Callahan, B. J. et al. DADA2: high-resolution sample inference from Illumina amplicon data. Nat. Methods 13, 581–583 (2016).
Schloss, P. D. et al. Introducing mothur: open-source, platform-independent, community-supported software for describing and comparing microbial communities. Appl. Environ. Microbiol. 75, 7537–7541 (2009).
de la Fuente-Arrillaga, C., Ruiz, Z. V., Bes-Rastrollo, M., Sampson, L. & Martinez-González, M. A. Reproducibility of an FFQ validated in Spain. Public Health Nutr. 13, 1364–1372 (2010).
Amezquita, R. A. et al. Orchestrating single-cell analysis with Bioconductor. Nat. Methods 17, 137–145 (2020).
Hao, Y. et al. Integrated analysis of multimodal single-cell data. Cell 184, 3573–3587.e29 (2021).
Boggy, G. J. et al. BFF and cellhashR: analysis tools for accurate demultiplexing of cell hashing data. Bioinformatics 38, 2791–2801 (2022).
Toral, M. et al. Carnitine palmitoyltransferase-1 up-regulation by PPAR-β/δ prevents lipid-induced endothelial dysfunction. Clin. Sci. 129, 823–837 (2015).
Garaude, J. et al. Mitochondrial respiratory-chain adaptations in macrophages contribute to antibacterial host defense. Nat. Immunol. 17, 1037–1045 (2016).
Dobin, A. et al. STAR: ultrafast universal RNA-seq aligner. Bioinformatics 29, 15–21 (2013).
Li, B. & Dewey, C. N. RSEM: accurate transcript quantification from RNA-seq data with or without a reference genome. BMC Bioinformatics 12, 323 (2011).
Love, M. I., Huber, W. & Anders, S. Moderated estimation of fold change and dispersion for RNA-seq data with DESeq2. Genome Biol. 15, 550 (2014).
Gu, Z., Eils, R. & Schlesner, M. Complex heatmaps reveal patterns and correlations in multidimensional genomic data. Bioinformatics 32, 2847–2849 (2016).
Romero-Becerra, R. et al. p38γ/δ activation alters cardiac electrical activity and predisposes to ventricular arrhythmia. Nat. Cardiovasc. Res. 2, 1204–1220 (2023).
Rodríguez, J. M. et al. iSanXoT: a standalone application for the integrative analysis of mass spectrometry-based quantitative proteomics data. Comput. Struct. Biotechnol. J. 23, 452–459 (2024).
Subramanian, A. et al. Gene set enrichment analysis: a knowledge-based approach for interpreting genome-wide expression profiles. Proc. Natl Acad. Sci. USA 102, 15545–15550 (2005).
Stamatelopoulos, K. et al. Amyloid-β (1–40) and mortality in patients with non-ST-segment elevation acute coronary syndrome. Ann. Intern. Med. 168, 855–865 (2018).
Stamatelopoulos, K. et al. Cathepsin S levels and survival among patients with non-ST-segment elevation acute coronary syndromes. J. Am. Coll. Cardiol. 80, 998–1010 (2022).
Wald, A. Sequential tests of statistical hypotheses. Ann. Math. Stat. 16, 117–186 (1945).
Hastie, T., Tibshirani, R. & Wainwright, M. Statistical Learning with Sparsity: The Lasso and Generalizations (Chapman & Hall, 2015).
DeLong, E. R., DeLong, D. M. & Clarke-Pearson, D. L. Comparing the areas under two or more correlated receiver operating characteristic curves: a nonparametric approach. Biometrics 44, 837–845 (1988).
Acknowledgements
The authors thank M. C. Collado for mouse gut microbiota analysis; M. O. Garmendia for assistance with the metadata from volunteers; members of the D.S. laboratory for help with discussions and critical reading of the manuscript; and the CNIC facilities, foremost the animal, cellomics, histology, metabolomics, genomics, microscopy, clinical trial and bioinformatics facilities, and personnel for assistance. I.R.-V. is funded by FJC2021-048099-I funded by MCIN/AEI/10.13039/501100011033 and European Union NextGenerationEU/PRTR. D.M. is funded by grant PRE2020-092578 MCIN/AEI/10.13039/501100011033. M.G. is funded by beca de formación de profesorado Universitario fellowship 20/01418. M.F.-M. is funded by INPhINIT Retaining 2024 from Caixa Foundation LCF/BQ/DR24/12080010. A.R.-U. is supported by Community of Madrid (PIPF-2022/SALGL-24581). R.B.-R. is funded by Beca de Formación de Profesorado Universitario Fellowship 20/03365. A. Devesa is scientifically supported by the Thrasher Research Fund and acknowledges the support of Sociedad Española de Cardiología (grant SEC/PRS-MOV-INT20/002). Work in the D.S. laboratory is funded by the CNIC; the European Union’s Horizon 2020 Research and Innovation Program under grant agreement ERC-2016-Consolidator Grant 725091; Ministerio de Ciencia, Innovación y Universidades (MICIU) PID2022-137712OB-I00, CPP2021-008310 and CPP2022-009762 MICIU/AEI/10.13039/501100011033 Agencia Estatal de Investigación, Unión Europea NextGenerationEU/PRTR; Comunidad de Madrid (P2022/BMD-7333 INMUNOVAR-CM); Scientific Foundation of the Spanish Association Against Cancer (AECC- PRYGN246642SANC); Worldwide Cancer Research WWCR-25-0080; European Union ERC-2023-PoC; a research agreement with Inmunotek S.L.; and la Caixa Foundation (LCF/PR/HR23/52430012 and LCF/PR/HR22/52420019). Work in the B.I. laboratory is supported by the European Commission (H2020-HEALTH 945118 and ERC-CoG 819775); the PID2022-140176OB-I00, PID2019-107332RB-I00 MCIN/AEI /10.13039/501100011033; and the Comunidad de Madrid RENIM P2022/BMD-7403. F.B. is funded by grants from the Swedish Heart Lung Foundation (20240882) and is a Wallenberg Fellow and recipient of an ERC-Advanced grant 2022 (101096705-IMPACT). K. Stellos was supported by the Deutsche Forschungsgemeinschaft (DFG, German Research Foundation — Project ID 394046768 — SFB1366 ‘Vascular control of organ function’ C07), the European Research Council (ERC) under the European Union’s Horizon 2020 research and innovation programme (MODVASC, grant agreement 759248), the German Centre for Cardiovascular Research (DZHK) and the Helmholtz-Institute for Translational AngioCardioScience (HI-TAC) of the Max Delbrück Center for Molecular Medicine in the Helmholtz Association (MDC) at Heidelberg University, Heidelberg, Germany. Metabolomics Workbench is supported by NIH grant U2C-DK119886 and OT2-OD030544 grants. The CNIC is supported by the Instituto de Salud Carlos III (ISCIII), the MICIU and the Pro CNIC Foundation, and is a Severo Ochoa Center of Excellence (CEX2020-001041-S funded by MICIU/AEI /10.13039/501100011033). The PESA study is funded by the CNIC and Santander Bank. This study was partially funded by an intramural grant CNIC-Severo Ochoa to B.I. and D.S.
Author information
Authors and Affiliations
Contributions
A.M., I.R.-V. and D.S. conceptualized and designed the study. A.M., I.R-V., D.M., J.A.-I., S.M.-C., V.N., I.F.-L., N.I., A.B., M.G., M.R.-T., M.F.-M., A.R.-U., R.B.-R., J.A.L., S.I., K.R.B. and V.A.-H. performed the experiments and analysed the data. A.C., K.R.B., S.I., A.F., I.F.-L., A. Dopazo, C.B., J.V., G.N., F.B., E.P., A.G.-M., D.C. and F.S.-M. supported the experiments and provided equipment and reagents. V.F., B.I., A. Devesa, M.L.-G., G.B. and A.G. developed clinical cohorts, including recruitment of patients, and assisted in the analysis of their results. K. Stamatelopoulos and K. Stellos contributed to data interpretation and provided conceptual input during manuscript revision. G.G. conducted the cohort study analyses and together with A.M., K. Stamatelopoulos and K. Stellos interpreted the human findings. D.S. and B.I. acquired funding. D.S. supervised the project. A.M., I.R.-V. and D.S. wrote the manuscript with input from all of the authors. All authors edited and approved the final manuscript.
Corresponding author
Ethics declarations
Competing interests
F.B. receives research funding from Biogaia AB and Novo Nordisk A/S, is co-founder and shareholder of Roxbiosens Inc., and is on the scientific advisory board of Bactolife A/S. F.B., K.R.B. and A.C. are co-founders and shareholders of Implexion Pharma AB. A.M., I.R.-V., D.S., B.I., V.F. and D.M. are inventors on a patent application titled Antagonists of the I1R for use in the Prevention and/or Treatment of an Autoinflammatory or Autoimmune Disease, publication number WO2025002914 (2025). The other authors declare no competing interests.
Peer review
Peer review information
Nature thanks Soraya Taleb and the other, anonymous, reviewer(s) for their contribution to the peer review of this work. Peer reviewer reports are available.
Additional information
Publisher’s note Springer Nature remains neutral with regard to jurisdictional claims in published maps and institutional affiliations.
Extended data figures and tables
Extended Data Fig. 1 High cholesterol diets and antibiotics modulate gut microbiota and plasma metabolites in ApoE−/− mice.
a, Experimental setup corresponding to Fig. 1 and Extended Data Fig. 1. ApoE−/− mice were fed different diets (chow, high cholesterol (HC), HC and high choline (HC/HC)) for 8 weeks. At 4 weeks post diet initiation, mice were treated or not with a cocktail of antibiotics (abx) in the drinking water. At sacrifice, aorta, heart, cecal content and plasma samples were collected and analysed. b, Stacked barplots showing the relative abundance of 16S rDNA sequences, at the genus level ( > 1% of total abundance), that are significantly different in cecal samples of the indicated groups. Genera shown are all significantly different between chow and HC diets by two-sided Kruskal-Wallis with Dunn’s correction test. n = 9. c, Relative abundance of TMAO in plasma measured by untargeted LC-MS. n = 10. d, Correlation of TMAO’s relative abundance with aortic arch lesion. Correlation coefficient (R) and p-value are calculated as the Pearson’s parametric correlation test. n = 29 (chow and HC n = 10 and HC/HC n = 9). e, Tandem mass spectrometry fragmentation by higher-energy collisional dissociation (HCD) using 50 eV as collisional energy of the imidazole propionate (ImP) standard (left) and endogenous m/z = 141.06535 mass from plasma of ApoE−/ − mice fed different diets as indicated. b-d, data are pooled from two independent experiments. c, Arithmetic mean ± SEM of each group is shown. Two-sided one-way ANOVA with Tukey post-hoc correction.
Extended Data Fig. 2 Metabolic and dietary features of asymptomatic volunteers from the PESA and IGT cohorts.
a, Plasma concentration of histidine and urocanic acid in healthy subjects (CTR) and subjects with subclinical atherosclerosis (AT) from the PESA cohort (left, CTR n = 105, AT n = 295, plasma concentration for both metabolites) and the IGT cohort (right, CTR n = 529, AT n = 1315, plasma concentration for both metabolites). Data on a base-10 Log scale. Median with interquartile range for each group is shown. ns: non-significant. b, Radar graph of loadings factors for each dietary pattern. c, ROC analysis for the additive value of ImP over LDL-C alone to discriminate subclinical total AT (left and center) and active AT (right). Left, PESA cohort: AUCImP+LDL-C 0.591 (CI: 0.524-0.639) vs. AUCLDL-C 0.533 (CI: 0.488-0.590), ΔAUC = 0.058 (CI: 0.01-0.127) p = 0.006. Center, IGT cohort: AUCImP+LDL-C 0.565 (CI:0.535-0.590) vs. AUCLDL-C 0.536 (CI: 0.508-0.565), ΔAUC = 0.029 (CI: 0.014-0.05) p = 0.008. Right, active AT: AUCImP+LDL-C 0.613, (CI: 0.554-0.659) vs. AUCLDL-C 0.502 (CI: 0.479-0.524), ΔAUC = 0.11 (CI: 0.061-0.189) p = 0.00042. d, ROC analysis for the additive value of ImP on the top of high-sensitivity C Reactive Protein (hs-CPR) to discriminate early AT (left and center) and active AT (right). Left, PESA cohort: AUCImP+hs-CRP 0.588 (CI: 0.525-0.651) vs. AUChs-CRP 0.511 (CI:0.501-0.532), ΔAUC = 0.077 (CI 0.014-0.133, p = 0.006. Center, IGT cohort: AUCImP+hs-CRP 0.559 (CI:0.530-0.584) vs. AUChs-CRP 0.530 (CI:0.10-0.552), ΔAUC = 0.029 (CI:0.06-0.053) p = 0.003. Right, active AT: AUCImP+hs-CRP 0.620, (CI: 0.567-0.674) vs. AUChs-CRP 0.514 (CI:0.501-0.536), ΔAUC = 0.11 (CI 0.054-0.155) p = 0.00042. e, Schematic representation of the distribution of volunteers from the PESA study. Based on multiterritorial/multimodal imaging (i.e. 2D/3D vascular ultrasound and non-contrast computed tomography), we classified 295 participants with subclinical atherosclerosis and 105 controls without atherosclerosis (green). Subjects with subclinical atherosclerosis were further stratified according to their uptake of Fluorodeoxyglucose (18F-FDG): those without any uptake considered as inactive atherosclerosis (FDGneg, yellow); those with metabolic activity in bone marrow (FDG + _BM, n = 40), arteries (FDG + _A, n = 57), or in both compartments (FDG + _SYS, n = 124) considered as active atherosclerosis (FDG + , red). Pictures are representative images of uptake in arteries and bone marrow.
Extended Data Fig. 3 The induction of atherosclerosis by ImP supplementation in chow-fed atherosclerosis-prone mice is independent of changes in cholesterol and glucose concentration.
a,b, Chow-fed Ldlr−/− mice were administered ImP (ImP) or not (CTR) in the drinking water for 12 weeks, followed by sacrifice and analysis. a, Oil red O en face staining of the aorta showing quantification of atherosclerotic lesions in whole aorta (left) and representative images (right). n = 10. b, Total cholesterol and glucose concentration in plasma. CTR = 10; ImP=9. c,d, Chow-fed ApoE−/− mice were treated with ImP or not (CTR) in the drinking water for 8 weeks. c, Masson’s trichrome staining of the aortic roots showing quantification of lesion area (left) and representative images (right). CTR = 10; ImP=13. Bar size= 500 µm. d, Quantification of atherosclerotic lesions by Oil red O en face staining of the aorta showing quantification in aorta (left), aortic arch (middle) and representative images of aorta (right). CTR = 17; ImP=19 e, Total cholesterol (n = 14) and glucose concentration (n = 15) in plasma. f, HC-fed Ldlr−/− mice were administered ImP (ImP) or not (CTR) in the drinking water for 12 weeks, Oil red O en face staining of the aorta showing quantification of atherosclerotic lesions in aorta (left) and representative images (right). n = 9. g, HC-fed Apoe−/− mice were administered ImP (ImP) or not (CTR) in the drinking water for 4 weeks, followed by sacrifice and analysis Oil red O en face staining of the aorta showing quantification of atherosclerotic lesions in aorta (left) and representative images (right). HC = 10; HC+ImP=9 a-g, Individual data and mean ± SEM from at least two pooled independent experiments. a,b,c,e,g, Two-tailed unpaired Student’s t test. d, Two-tailed Mann–Whitney U test. f, One-tailed unpaired Student’s t test.
Extended Data Fig. 4 Increased ImP in circulation induces atherosclerosis and systemic inflammation in chow-fed atherosclerosis-prone mice.
a-k, Chow-fed ApoE−/− mice were administered ImP for 4 or 8 weeks as indicated. a, Numbers of RORγt in CD4+ T cells in blood at sacrifice. Left: n = 7. Right: representative density plots for CTR (top) and ImP (bottom). b,c UMAP embeddings of whole aorta-derived cells profiled by scRNAseq colored by cell type, regardless of treatment duration (b) and by treatment and time (c). d, Dot plot of cell type markers used to identify main cell populations. e, UMAP embedding (left) and cell proportions (right) labelled by cell type of whole aorta-derived cells based on transcriptomic profiles from chow-fed ApoE−/− mice after 4 weeks of ImP administration. f, Quantification of atherosclerotic lesions by Oil red O en face staining of the aorta, showing quantification in whole aorta (left), aortic arch (middle) and representative images (right) following 4 weeks of ImP administration. CTR = 10; ImP=8. g-i, Numbers of circulating Ly6Chigh monocytes CTR = 7; ImP=10 (g), CD90+ T cells, B220+ B cells and F4/80+ Macrophages CTR = 9; ImP=10 (h) after 4 weeks of ImP administration determined by flow cytometry. i, Total numbers of CD45+ cells, CD90+ T cells and B220+ B cells infiltrated in aorta after 8 weeks of ImP administration by flow cytometry analysis. CTR = 9; ImP=10. j, Staining of CD3+ cells in intima/media layer in aortic roots showing quantification (left) and representative images (right) of infiltrated T cells after 8 weeks of ImP administration. CTR = 11; ImP=16. Bar size = 500 µm. k, MAC2 staining inside atheroma plaque showing MAC2+ area quantification (left) and representative images (right) after 8 weeks of ImP administration. CTR = 9; ImP=12, Bar size = 500 µm. l, ImP was administered (ImP) or not (CTR) to Ldlr−/− mice grafted with BM from WT (CTR = 9, ImP=10) or Rag1−/− (CTR = 10, ImP=8) and fed chow diet for 12 weeks. Quantification of atherosclerotic lesions by Oil red O en face staining of the aorta, showing quantification in whole aorta. f-l, Individual data and mean ± SEM from at least two pooled independent experiments. a, f (left),h-k, Two-tailed Unpaired Student’s t test. f (right), g, h (left), Two-tailed Mann–Whitney U test. l, One-way ANOVA with Tukey post-hoc correction.
Extended Data Fig. 5 ImP induces transcriptional changes in fibroblasts, macrophages and endothelial cells.
a-g, Chow-fed ApoE−/− mice were administered ImP and the aorta-derived cells from the scRNAseq were analysed. a-c, Dot plot of expression levels of cell type markers used to identify cell subclusters for macrophages (MFs) (a), fibroblasts (FBs) (b), and endothelial cells (ECs) (c). d-f, Table of representative gene ontology (GO) terms enriched in the subclusters of MFs (d), FBs (e) and ECs (f). All shown GO terms are significant (adjusted p-value ≤ 0.05). g, Relative abundance (log-ratio) of the subcluster cell proportions comparing ImP treatment vs CTR, regardless of the treatment duration. h, MCP1 concentration measured by ELISA in the supernatant of MEFs treated with ImP for 24 h. n = 10. i, Number of post-migration monocytes collected in the bottom chamber in response to supernatant from (h) and quantified by flow cytometry. n = 7. j, Heat map of gene set enrichment analysis (GSEA) from RNAseq analysis of bone marrow-derived macrophages (BMDMs), mouse embryonic fibroblasts (MEFs) and mouse aortic ECs (MAECs) comparing ImP stimulation after 1 h and 2 h vs unstimulated conditions within each cell type. k, GSEA enrichment plots of phosphopeptides related to the mTOR pathway from BMDMs (top) and MEFs (down) after ImP treatment for 180 min compared with unstimulated cells. Global abundances of all peptides related to the mTOR pathway were used for the analysis. l,m, BMDMs (left) and MEFs (right) after ImP stimulation for 24 h with or without rapamycin co-incubation. l, Flow cytometry staining for pS6 ribosomal protein. Left: BMDM n = 8; MEF CTR = 10; ImP=10; ImP + AGN = 9; Right: representative histograms for CTR (top), ImP (middle) and ImP + rapamycin (bottom). m,TNF production measured by ELISA. BMDM n = 7; MEF n = 9 n, Flow cytometry staining for pS6 in peritoneal macrophages harvested from chow-fed ApoE−/− mice administered ImP for 8 weeks. Left: n = 9. Right: representative histograms for CTR (top), ImP (bottom). o, ImP was administered (ImP) or not (CTR) to Ldlr−/− mice grafted with BM from control Raptorf/f (CTR = 17; ImP=18) or Lyz2ΔRaptor (CTR = 15; ImP=18) and fed chow diet for 12 weeks. Quantification of atherosclerotic lesions by Oil red O en face staining of the aorta, showing quantification in whole aorta. a-c, Wilcoxon rank sum test comparing cell clusters. Adjusted p-value < 0.05. g, Two-proportions Z-test. h,i, Data are pooled from n = 7 independent experiments. h, Two-tailed Unpaired Student’s t test. i, Two-tailed Mann–Whitney U test. j, Kolmogorov Smirnov test. k, Nominal p-values were calculated using a 1000-permutation test. l,m,o, Individual data (each one represent an independent experiment) and mean ± SEM. One-way ANOVA with Tukey post-hoc correction. n, Individual data and mean ± SEM of at least two pooled independent experiments. Two tailed unpaired Student’s t test between CTR and ImP. *p < 0.05; **p < 0.01; ***p < 0.005; ****p < 0.001.
Extended Data Fig. 6 Imidazoline-1 receptor mediates functional responses that are induced by ImP.
a,b, Bone marrow-derived macrophages (BMDMs) and mouse mouse embryonic fibroblasts (MEFs) were treated in vitro with ImP (or not, CTR) and co-incubated with AGN192403 (AGN, I1R antagonist), Idazoxan (IR and adrenoreceptor (α2) antagonist) or Yohimbine (α2 antagonist). a, Flow cytometry staining for pS6 (left, n = 10) and representative histograms (right) corresponding to each treatment matched by color. b, TNF production in 24 h culture supernatant by ELISA (BMDMs: CTR = 11, ImP+medium=12, ImP+AGN = 9, ImP+idazoxan=7, ImP+yohimbine=7; MEF: n = 10 for all groups). c,d MEFs were transfected with I1R siRNA (siNisch) or control siRNA (siCTR) and stimulated with ImP or not (CTR) and co-incubated or not with AGN192403 (AGN) as indicated. c, Flow cytometry staining for pS6, showing quantification of percentage of pS6 positive cells (left, n = 4) and representative histograms (right) corresponding to each treatment indicated and matched by color. d, TNF production in 24 h culture supernatant by ELISA. n = 4. e, CD45+CD11b+ and CD45+CD3+ splenic cells were isolated to analyse Nisch mRNA relative expression by qRT-PCR. CD11b+ Nischf/f = 3, CD11b+ Lyz2ΔNisch = 5; CD3+ Nischf/f = 3, CD3+ Lyz2ΔNisch = 5; f,g BMDMs were generated from Nischf/f or Lyz2ΔNisch mice and treated or not (CTR) with ImP in vitro. f, Flow cytometry staining for pS6, showing quantification of percentage of pS6 positive cells (left) and representative histograms (right) corresponding to each treatment matched by color. Nischf/f CTR = 5, Nischf/f ImP=5, Lyz2ΔNisch CTR = 7, Lyz2ΔNisch ImP=7. g, TNF production in 24 h culture supernatant by ELISA. Nischf/f CTR = 5, Nischf/f ImP=5, Lyz2ΔNisch CTR = 7, Lyz2ΔNisch ImP=7.h. ImP was administered (ImP) or not (CTR) to Ldlr−/− mice grafted with BM from control Nischf/f or Lyz2ΔNisch and fed chow diet for 12 weeks. Quantification of atherosclerotic lesions in the aorta by Oil red O en face staining of the aorta. n = 17-20 a,b, Arithmetic mean ± SEM and individual data from biological replicates. One-way ANOVA with Tukey post-hoc correction. c,d, Arithmetic mean ± SEM and individual data from n = 4 pooled independent experiments. One-way ANOVA with Tukey post-hoc correction. e, Arithmetic mean ± SEM and individual data from biological replicates. Two tailed unpaired Student’s t test between Nischf/f and Lyz2ΔNisch. f,g, Arithmetic mean ± SEM and individual data. One-way ANOVA with Tukey post-hoc correction. h, One-way ANOVA with Tukey post-hoc correction Nischf/f (CTR = 17, ImP=20) or Lyz2ΔNisch (CTR = 19 ImP=18). In all panels, n indicates biological replicates.
Extended Data Fig. 7 Inhibition of the ImP/I1R axis with AGN192403 prevents ImP-induced immune and inflammatory response without affecting circulating ImP and cholesterol concentration.
a-i, ImP was administered (or not, CTR) in the presence of AGN192403 (AGN) or not (ImP) in drinking water to ApoE−/− mice fed chow diet for 8 weeks, followed by sacrifice and analysis. a, Oil red O en face staining of the aorta showing quantification of atherosclerotic lesions in whole aorta in male mice. CTR = 15; ImP=17; ImP + AGN = 16. b, Oil red O en face staining of the aorta showing quantification of atherosclerotic lesions in whole aorta (left), aortic arch (middle) and representative images (right) in female mice. CTR = 7; ImP=17; ImP + AGN = 16. c, Total cholesterol concentration in plasma. Male mice (left), CTR = 14; ImP= 13; ImP + AGN = 15, and female mice (right), CTR = 7; ImP=17; ImP + AGN = 14. d, Imidazole Propionate concentration in plasma of male mice at sacrifice. CTR = 10; ImP=13; ImP + AGN = 17. e,f, Number of T-bet in CD4+ T cells. (e), and CD90+ T and B220+ B cells (f) in blood at sacrifice by flow cytometry. CTR = 9; ImP=10; ImP + AGN = 10 (e) and n = 15 (f). g-j Number of aorta infiltrated T-bet+ Th1. CTR = 9; ImP=7; ImP + AGN = 7 (g) and FoxP3+ Treg cells CTR = 9; ImP=7; ImP + AGN = 7 (h), B220+ B cells. n = 10 (i) and F4/80+ Cd11c+ cells. CTR = 9; ImP=10; ImP + AGN = 10 (j) by flow cytometry. e,f,j, Right: representative density plots for CTR (top), ImP (middle) and ImP+AGN (bottom). a-j, Arithmetic mean ± SEM and individual data from at least two pooled independent experiments. One-way ANOVA with Tukey post-hoc correction.
Extended Data Fig. 8 Inhibition of the ImP/I1R axis with AGN192403 prevents HC-induced atherosclerosis without affecting circulating ImP and cholesterol concentration.
a-e, ApoE−/− mice were fed a chow diet or high cholesterol (HC) diet for 8 weeks. At 4 weeks post-diet initiation, AGN192403 was administered (AGN) or not in the drinking water to mice fed HC diet until week 8, followed by sacrifice and analysis. a, Oil red O en face staining of the aorta in male mice showing quantification of atherosclerotic lesions in the whole aorta. Chow=15; HC = 14; HC + AGN = 13. b, ImP concentration in plasma of male mice at sacrifice. Chow=10; HC = 14; HC + AGN = 13. c, Oil red O en face staining of the aorta in female mice showing quantification of atherosclerotic lesion in the whole aorta (left), aortic arch (middle) and representative images (right). Chow=8; HC = 15; HC + AGN = 18. d, Caspase 3 staining of aortic roots. Quantification of caspase-3+ (left) and representative images of caspase-3 staining (right). Bar size= 500 µm. Chow=12; HC = 13; HC + AGN = 14. e, Total cholesterol concentration in plasma in male (left), n = 15, and female mice (right), Chow=7; HC = 14; HC + AGN = 17, at sacrifice. a-e, Arithmetic mean ± SEM and individual data from at least two pooled independent experiments. One-way ANOVA with Tukey post-hoc correction.
Supplementary information
Supplementary Information
Supplementary Figs. 1–3, Supplementary Tables 1a,b, 2a,b and 3–5.
Source data
Rights and permissions
Open Access This article is licensed under a Creative Commons Attribution-NonCommercial-NoDerivatives 4.0 International License, which permits any non-commercial use, sharing, distribution and reproduction in any medium or format, as long as you give appropriate credit to the original author(s) and the source, provide a link to the Creative Commons licence, and indicate if you modified the licensed material. You do not have permission under this licence to share adapted material derived from this article or parts of it. The images or other third party material in this article are included in the article’s Creative Commons licence, unless indicated otherwise in a credit line to the material. If material is not included in the article’s Creative Commons licence and your intended use is not permitted by statutory regulation or exceeds the permitted use, you will need to obtain permission directly from the copyright holder. To view a copy of this licence, visit http://creativecommons.org/licenses/by-nc-nd/4.0/.
About this article

Cite this article
Mastrangelo, A., Robles-Vera, I., Mañanes, D. et al. Imidazole propionate is a driver and therapeutic target in atherosclerosis. Nature 645, 254–261 (2025). https://doi.org/10.1038/s41586-025-09263-w
Received:
Accepted:
Published:
Version of record:
Issue date:
DOI: https://doi.org/10.1038/s41586-025-09263-w
This article is cited by
-
The gut–heart axis in coronary artery disease: a scoping and narrative review of sex-based microbial and metabolic disparities
Biology of Sex Differences (2026)
-
Role of gut microbiota metabolites against vein graft restenosis: insights from network pharmacology, molecular docking and molecular dynamic simulation
BMC Medical Genomics (2025)
-
The gut metabolite imidazole propionate is a potential biomarker of and therapeutic target for atherosclerosis
Nature Reviews Cardiology (2025)
-
Gut microbiota–derived metabolite drives atherosclerosis
Nature Reviews Drug Discovery (2025)
-
Gut bacteria make a molecule that promotes plaque build-up in arteries
Nature (2025)
