Abstract
Magnetic materials are usually classified into a distinct category such as diamagnets, paramagnets or ferromagnets. The enormous progress in materials science allows one nowadays, however, to change the magnetic nature of an element in a material. Gold, in bulk form, is traditionally a diamagnet. But in a ferromagnetic environment, it can adopt an induced ferromagnetic moment. Moreover, the growth of gold under certain conditions may lead to a spontaneous ferromagnetic or paramagnetic response. Here, we report on paramagnetic gold in a highly disordered Au–Ni–O alloy and focus on the unusual magnetic response. Such materials are mainly considered for plasmonic applications. Thin films containing Au, Ni and NiO are fabricated by co-deposition of Ni and Au in a medium vacuum of 2 × 10⁻² mbar. As a result, Au is in a fully disordered state forming in some cases isolated nanocrystallites of up to 4 nm in diameter as revealed by high resolution transmission electron microscopy. The disorder and the environment, which is rich in oxygen, lead to remarkable magnetic properties of Au: an induced ferromagnetic and a paramagnetic state. This can be proven by measuring the x-ray magnetic circular dichroism. Our experiments show a way to establish and monitor Au paramagnetism in alloys.
Introduction
Gold (Au) is an inert noble transition metal with 5d electrons. The crystal structure is face-centered cubic (fcc). It is known as a typical diamagnetic material with negative magnetic susceptibility. As an isolated atom, Au has completely filled 5d states, so there is no magnetic moment. In metallic form, there is a small number of holes in the 5d band due to self-hybridization effects. During the last 15 years, outstanding scientific research on Au has been performed using element-specific techniques carried out in synchrotron-radiation facilities. It has been demonstrated by x-ray magnetic circular dichroism (XMCD) that Au can acquire an induced magnetic moment when it forms alloys or layered-film structures with 3d ferromagnetic transition metals1,2,3. Ferromagnetism in tiny Au nanoparticles, without or with thiol-group capping, has also been reported4,5,6. More recently, paramagnetism in both, bulk Au and Au nanoparticles has attracted the scientific interest: Suzuki et al. probed Pauli and orbital paramagnetic state in bulk gold by XMCD7. Bartolomé et al. showed that for Au nanoparticles deposited on a Sulfolobus acidocaldarius S layer, the magnetic moment per paramagnetic Au atom was 25 times larger than in other Au nanoparticles measured at that time8. From these studies, an additional interest emerged for further investigation of Au paramagnetism on different probe systems and in various environments.
According to ref.8, the key factor for discovering paramagnetic gold is the increase in the number of 5d holes. This may originate from a charge transfer from Au atoms in nanoparticles to other atoms and/or the existence of Au in the form of tiny crystals or clusters with open bonds. Therefore, in this work, we intentionally fabricated a highly disordered system containing tiny nanoparticles of Au and Ni. A large percentage of Ni is oxidized. By means of XMCD experiments, we record for Au an induced ferromagnetic state for small magnetic fields followed by a paramagnetic state up to 17 T. The two contributions can be separated. Our experiments show a way to establish and probe Au paramagnetism in alloys. Up to now, only one paper reported on Au paramagnetism, exhibited by nanoclusters grown on an archaeal-cell-wall surface layer8. Our work shows a more systematic way to grow nano-systems in which it is possible to detect Au paramagnetism. Last but not least, Au in NiO is an interesting, plasmonic system9,10,11. It finds many applications, amongst others, in catalysis, photovoltaics and gas sensing.
Results
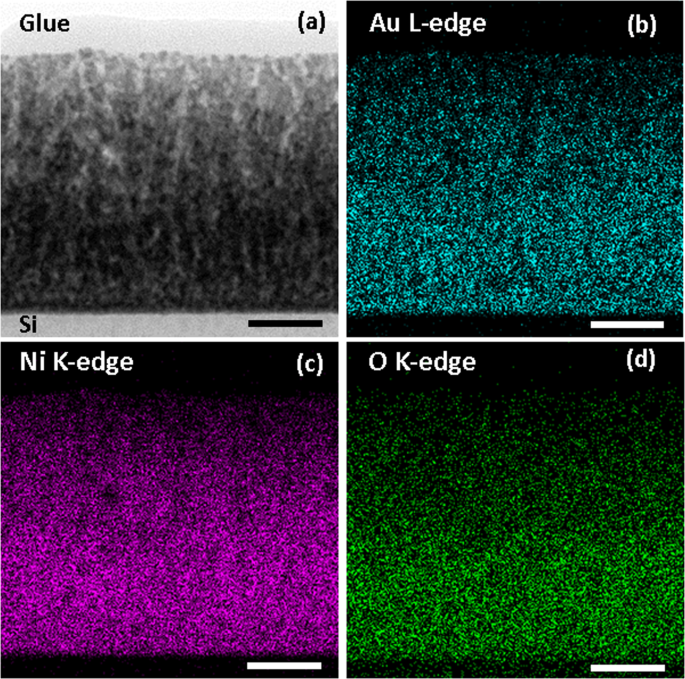
In Fig. 1, a cross-section scanning transmission electron microscopy (STEM) image and the results of energy-dispersive X-ray spectroscopy (EDS) analysis are shown. The chemical analysis presented by EDS-STEM images indicates that Au atoms are homogeneously distributed in the Au-Ni-O thin film. Within the accuracy of the EDS detector of 5%, the film contains about 8 at. % Au, with about two thirds of Ni being oxidized.
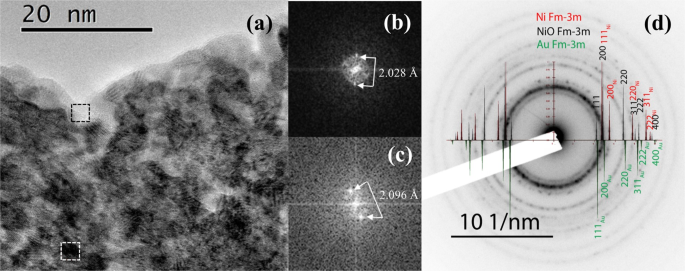
In Fig. 2(a), a cross-section high-resolution transmission electron microscopy (HRTEM) image is shown. We clearly see the polycrystalline nature of the Au-Ni-O thin film. The average size of the crystallites is less than 5 nm in diameter. They feature various shapes. The overall thickness of the film, determined with high precision, was 103 ± 1 nm. Electron diffraction [Fig. 2(d)] confirms the presence of both, NiO and Ni Fm-3m phases. The presence of Au rings could not be verified in the electron diffraction of large areas of the image due to fact that the Au interplanar distances are very close to the NiO ones. Furthermore, taking into account the enlargement of the NiO rings due to the small size of the crystallites, they most probably overlap with the ones from Au.
Since we could not separate NiO from Au contributions by electron diffraction, a thin TEM lamella has been prepared. To enhance the contrast, a series of under-focus HRTEM images close to the thinnest area of the TEM lamella has been taken in order to measure directly the interplanar distances. From fast Fourier transform (FFT), extracted from small black and small bright areas in Fig. 2(a), the measured interplanar distances were found to correspond to Au [Fig. 2(b)] and to NiO [Fig. 2(c)], respectively. For the majority of grey areas, the size of the Au crystals is smaller than the thickness of the TEM lamella and, as a result, the measured distance is averaged between Au and NiO. Note also that HRTEM in a similar but only 10 nm thick film showed the presence of partially amorphous material; only part of Au was in crystalline form with a few isolated grains up to 2 nm in diameter11. In the present work, we could not identify amorphous material, so Au is in cubic fcc crystalline form consisting of tiny nanocrystals (smaller than about 4 nm, see Fig. 2(a), black areas). The existence of open bonds (Au in form of incomplete crystals or clusters) cannot be ruled out either. In ref.11, a part of Ni was in the hexagonal hcp phase. Hexagonal Ni in bulk form does not affect the magnetic properties of its environment as it is non-magnetic12,13. In the form of small nanoparticles, hcp Ni could also show some antiferromagnetism14. However, in the thick Au-Ni-O film of this study no hcp Ni was evidenced. The common conclusion of both studies, this one and ref.11, is that they show evidence of a highly disordered system.
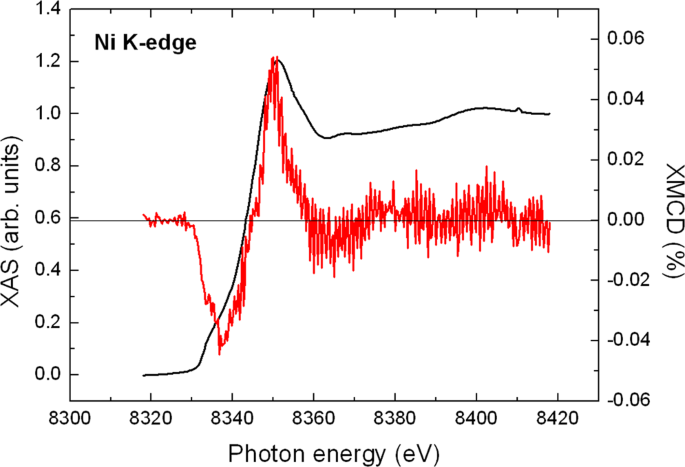
In Fig. 3, the spectra of X-ray absorption spectroscopy (XAS) and XMCD at the Ni K-edge of our film are plotted. The XAS recorded on the film is a linear combination of XAS of Ni in NiO and pure Ni. According to EDS, the total amount of Ni in the sample is 55%, of which 35% is NiO and 20% is Ni metal. The XAS measures all Ni atoms of the sample, i.e. the spectral shape of the XAS is a mixture between NiO and Ni metal. The XAS spectrum resembles more the one of NiO (crystallized in a slightly rhombohedrally-distorted cubic NaCl structure)15 than the one of bulk fcc Ni16,17. This observation confirms the results of EDS and HRTEM that most of Ni is oxidized. On the other hand, the spectral shape of the XMCD signal corresponds for the most part to the one of Ni metal. However, this XMCD signal is much smaller than the one expected for fcc Ni. This can be clearly seen by a direct comparison of the XMCD Ni signal of Fig. 3 to the one appearing in ref.17 for pure fcc bulk Ni. Since NiO is an antiferromagnet, it has zero contribution to the XMCD signal. Hence, the small Ni K-edge XMCD is due to the small percentage of fcc Ni in the sample. From its amplitude, we can deduce that at most 20% of the Ni atoms belong to ferromagnetic Ni metal. Differences in the line shape of the XMCD as compared to bulk Ni17 may arise from the small size effects (low dimensionality) of the Ni fcc clusters. These effects may modify the density of states and, consequently, the orbital magnetism, which is probed through the K-edge XMCD signal. A further reduction of the signal may originate from disorder. Indeed, disorder was shown to reduce Ni K-edge XMCD in NiMnGa alloys18. Finally, one has to consider that in some cases disorder and strain may induce a ferromagnetic phase in NiO, see e.g. ref.19 and references therein. In this case, the average magnetization increases with decreasing particle size, which is correlated to an increase in the number of uncompensated spins at the surface with respect to the core. Such a phase could also contribute to the Ni XMCD signal.
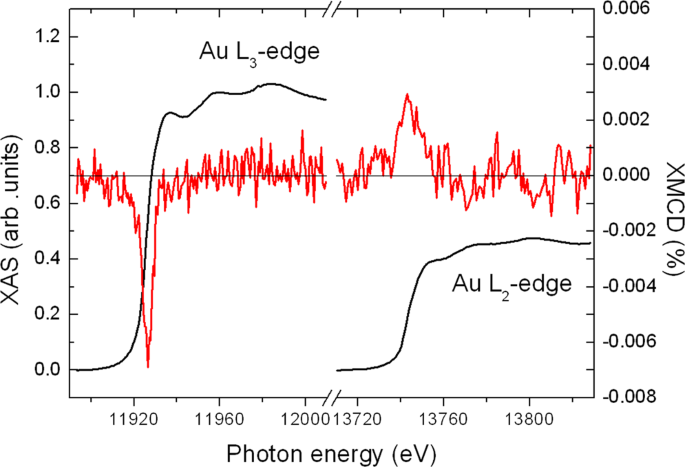
In Fig. 4, the XAS and XMCD spectra recorded at 295 K under a field of 17 T at the L3 and L2 edge of Au are plotted for the Au-Ni-O film. For the XAS spectra, the ratio of the L3 and L2 intensity was normalized to 2.24:1 according to ref.20. This value is also very close to the value of 2.2:1 reported by Tyson et al.21. The finite XMCD signal reveals that Au possesses a magnetic moment. Knowing the direction of the magnetic field and the helicity of the beam, we conclude that Au is polarized parallel to the magnetic field and to the Ni magnetic moment.
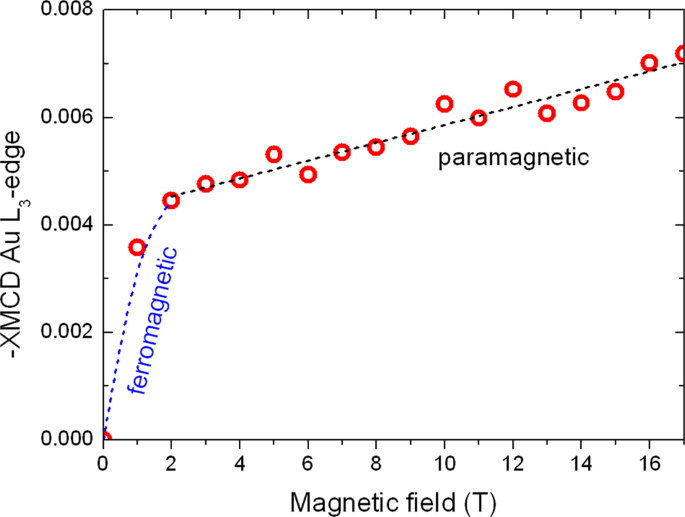
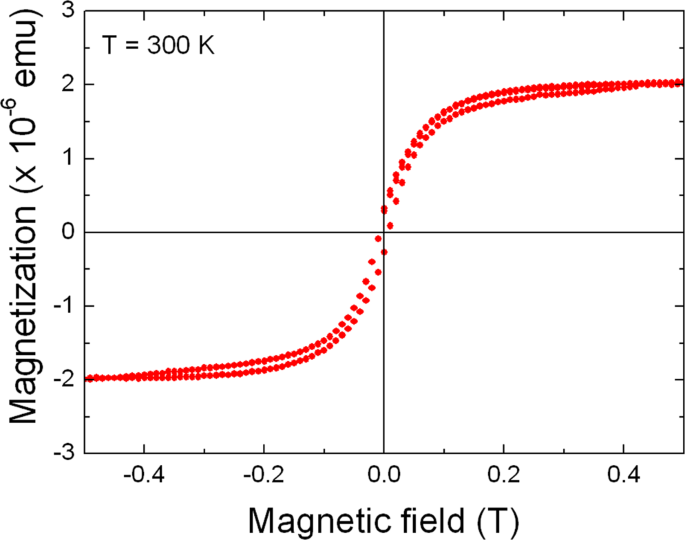
By setting the monochromator at the maximum of the L3 XMCD signal of Au and increasing the magnetic field to 17 T, we have recorded an element-specific magnetization curve for Au. It is a well-known advantage of the XMCD technique to allow recording of element-specific magnetization curves22,23. The result is plotted in Fig. 5. A rather abrupt increase is seen at applied fields lower than 1 T, followed by a slow linear response up to 17 T. Since the field increment is 1 T, the behavior near zero is not known in detail. Nevertheless, the low-field behavior may be attributed to an induced magnetic moment of Au that is spin-polarized by ferromagnetic Ni, Alternatively, it might originate from a polarization of Au by superparamagnetic Ni. To clarify this, magnetization measurements were performed with a Quantum Design superconducting quantum-interference device vibrating-sample magnetometer (SQUID VSM). As illustrated in Fig. 6, a hysteresis loop of the 200 nm thick sample has been recorded at 300 K. The corrected magnetization loop, i.e., after subtraction of a contribution of the diamagnetic Si substrate, is typical for a soft ferromagnetic polycrystalline material with a coercivity of 7.5 mT. The hysteresis is completed at about 0.5 T and the magnetization reaches a saturation value of 2 × 10⁻⁶ emu.
Discussion
The induced magnetic moments of Pd, Pt, and even Au, in a ferromagnetic environment, probed by XMCD, was the target of a few papers in the nineties and afterwards. For the first two elements, there were results for magnetic polarization by Fe, Co and Ni24,25. Au, as far as we know, is known to be polarized only by Co1 or Fe3. Therefore, it is reasonable to expect that Ni could also spin-polarize Au, e.g. in ferromagnetic Ni/Au multilayers or NiAu alloys. This is the behavior of Au in our sample under fields up to approximately 1 T, as one can conclude from Figs 5 and 6. Note that NiO is an antiferromagnet and such transition-metal oxides were, up to now, not shown to be able to produce proximity effects even to easily spin-polarizable elements such as Pt26,27.
Even more interesting is the observation of the slow linear increase, which is typical for paramagnetic materials. Au is not a paramagnet but it has been shown to possess a very small Pauli paramagnetic susceptibility in bulk7. Under special circumstances, in the form of nanoparticles grown on special substrates, it can show a strong paramagnetic behavior8. In order to quantify the paramagnetic behavior of Au in our system, the susceptibility of Au has to be determined, which is defined as χ = dM/dH, where M is the magnetization and H the magnetic-field strength. Therefore, we applied on the spectra of Fig. 4 the analysis procedure for 4d and 5d elements with small white-line intensities, developed for Pd and Ag in Fe/Pd multilayers24. The XAS spectra at the L edges of the transition metal in the film has to be compared with bulk Ag or Au material (usually a pure metallic gold foil is measured as a reference) and the number nh of d holes of Ag or Au has to be taken into account24,25. This method works well if the sample has the fcc structure of the reference.
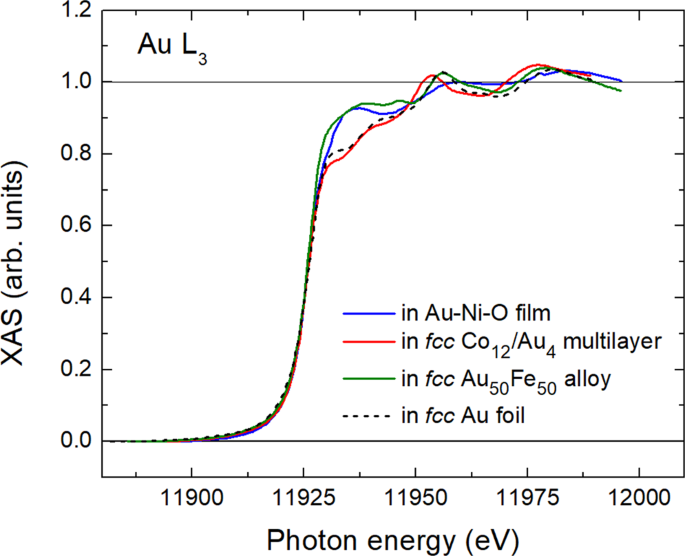
In Fig. 7, we plot the XAS spectra at the L3 edge of Au in our film, in a fcc Co12/Au4 multilayer1 (the indices 12 and 4 refer to the number of atomic layers in a multilayer period), in a fcc Au50Fe50 alloy3 and in a fcc reference gold foil. The reference-foil measurements have been done using a 0.1 mm thick gold foil from Goodfellow with 99.999 at.% purity, which gave the same results as a Au single crystal (99.999 at.% purity, from MaTeck). The energy axis of the spectrum of Au in the reference foil was stretched in order to match the one of Au in the alloy, where the atomic distances are different from bulk Au23. One may observe that (i) the spectroscopic features of Au after the edge are quite similar for the latter three fcc samples but less for Au in Au-Ni-O. The simple, almost sinusoidal spectroscopic profile of Au in our Au-Ni-O sample reminds of the one of elements in amorphous environments28. In our film, we suggest that this is due to large disorder. (ii) In the case of Co/Au multilayers, there is practically no change of the white-line intensity of Au as compared to the reference Au foil. However, white-line intensity increases for both, Au in the AuFe alloy and Au in our sample. In AuFe alloys, this effect was attributed to hybridization between Au 5d and Fe 3d states, which resulted in a charge transfer from Au to Fe3. Obviously, between the less-reactive Co and Au no such charge transfer occurs, leaving the white-line intensity of Au unaltered. One should also expect that the presence of the almost inert Ni would have a similar negligible influence on the white-line intensity of Au in the Au-Ni-O film. Therefore, the white-line intensity increase could be attributed to a probable charge transfer from Au to oxygen or NiO. Indeed, XAS experiments in Au2O3 revealed a very large increase in the white line at the L3 absorption edge of Au29. On the other hand, a less significant white-line intensity increase, more or less similar to our case, was reported for Au nanoparticles about 10 nm in diameter embedded in a NiO matrix with incorporated hydrogen15. Combination of XAS with measurements of the electrochromic effect revealed a charge transfer between NiO and Au15. Besides this charge transfer, the size of Au clusters, e.g. in a disordered material, can also be thought responsible for white-line intensity changes30. Therefore, both effects could contribute to the white-line increase observed in our film.
The fact that the XAS of Au in our sample does not match the one of fcc Au, because the lattice symmetry is different, does not allow analyzing our spectra following ref.26. In such a case, an approximate method can be followed, adopted for hcp CoCrPt alloys31. It has also been used in the evaluation of the Au moment in a bcc Au97Fe3 alloy3. After normalizing the XAS spectra, we compare the integrated XMCD spectra of Au in our film to the ones of Au in the pure metallic fcc gold foil. This idea is justified by the fundamental principle that the sum rules establish a simple linear relationship between the magnitude of the XMCD signal and the magnetic moment, for a detailed discussion, see ref.32. Application of this principle to the spectra of Au in Fig. 4 allows one to estimate with an accuracy of the order of 20% a very small total 5d magnetic moment of about 0.016 μB/atom for Au in our film in a field of 17 T. This value is more than one order of magnitude smaller than the 5d moment of Au in a Au50Fe50 alloy. As Fig. 5 shows, practically 60% of this value is due to induced ferromagnetic moment and the rest is a paramagnetic contribution.
By scaling the y axis of Fig. 5 in μB/at of Au, one may estimate from the slope of the linear part of the curve the paramagnetic susceptibility of Au. The value we calculate is χ = 3.5 × 10⁻⁷ μB/at-Oe. In SI units, this amounts to χ ~ 2 × 10⁻³. This value falls well within the range of susceptibility values observed in paramagnetic materials33. The value is comparable to the susceptibility at 10 K of Au nanoparticles deposited on an archaeal-cell-wall surface layer8. The charge transfer in that case was found to be 0.152 electrons8. In our work, we can give only a rough estimate because the white-line intensity in our sample is comparable to the one in a AuFe alloy (Fig. 7). Thus, the charge transfer is about 0.045 electrons. This value may be determined from the Au spectra of ref.3 and the use of a Au spectra for an Au4Mn alloy, in a similar manner as described in ref.8.
An interesting point to be discussed is the fundamental origin of the paramagnetic Au behavior. The most straightforward justification would be the existence of localized moments on the tiny Au nanocrystallites and clusters. In principle, Pauli paramagnetism could have been expected by Au crystallites that are substantially larger than ours, in order that proper electronic bands of Au can develop. Pauli paramagnetism would probably result in smaller susceptibility values6 than those determined in this work. However, a few papers suggest that the metallic character is preserved even for small clusters of gold34, sodium35 and palladium36. In the case of Pd, a large susceptibility was observed at low temperatures, while Pauli paramagnetism was noticeable even at room temperature. Therefore, in the present work, our experiments cannot clearly exclude the existence of Pauli paramagnetism.
Conclusions
In this work, strongly disordered films of Au-Ni-O have been grown. The Au concentration was about 8 at.%. Via XMCD measurements, we observed an induced magnetic moment of Au, showing as a function of applied magnetic field an initially abrupt increase, followed by a slow increase up to 17 T revealing a paramagnetic contribution. The total magnetic moment of Au at 17 T is 0.016 ± 0.003 μB/atom; 60% of it is due to a ferromagnetic contribution and the rest is attributed to Au paramagnetism most probably due to localized moments. A paramagnetic susceptibility χ ~ 2 × 10⁻³ (in SI units) is found for Au; this value falls well within the range of susceptibility values observed in paramagnetic materials. Finally, we have demonstrated that it may not be extraordinary to observe paramagnetic gold in nature. The key idea is to put Au atoms in a disordered state in tiny isolated crystallites (with diameter smaller than about 4 nm as the present works shows) or in clusters surrounded by atoms that may attract some charge from Au, such as oxygen atoms. Our work could open the road for the preparation of samples with similar methodologies in order to make further investigations on the interesting and up to now rare phenomenon of Au paramagnetism.
Methods
Two films, 100 nm and 200 nm thick, were prepared under identical experimental conditions in medium vacuum with base pressure 2 × 10⁻² mbar by co-deposition of Au and Ni using direct-current magnetron sputtering. The medium vacuum results in the formation of a precursor-material thin film where a significant amount of oxygen is trapped inside the film. The presence of oxygen and the relatively low deposition temperature, which is room temperature, result in a quenching of the deposited material prohibiting crystal growth. This is obvious for room-temperature growth due to low diffusion rates. The presence of oxygen also results in a decreased size of crystallites. As for most metals during thin-film growth, oxygen is first incorporated in the grain boundaries prohibiting crystal growth, see e.g. ref.37. Therefore, as is shown by HRTEM, the thin film consists of tiny nanocrystals while part of it is amorphous. This material was previously shown to produce after annealing high-quality plasmonic thin films11.
Annular bright field imaging and EDS were collected by STEM with a JEOL 2100 F FEG microscope operating at 200 kV with 0.2 nm resolution in scanning mode. EDS experiments were carried out with the novel Centurio silicon drift detector with a large solid angle of up to 0.98 steradians from JEOL. HRTEM experiments have been performed in a JEOL 2011 microscope with a point resolution of 0.19 nm. All TEM lamella have been prepared using Multiprep semi-automatic tripode polishing and finished with Ar-ion thinning.
The XMCD experiments were performed at the ID12 beamline of the European Synchrotron Radiation Facility in Grenoble (France) at the L3 and L2 edge of Au at 295 K and the K edge of Ni at 2 K using highly efficient fluorescence-yield detection mode in backscattering geometry38. XAS spectra were recorded under external fields up to 17 T. The XAS spectra at the Ni K edge and Au L3 edge were normalized to unity. The experiments were performed at grazing incidence (15° with respect to the film plane). The progress in third-generation synchrotron-radiation facilities has made possible the detection of the Au XMCD signal at the Au L edges with relatively good signal-to-noise ratio for a 100 nm thin film containing only about 8 at. % Au. To exclude any experimental artifacts, the XMCD spectra were recorded either by changing the helicity of the incoming light or by inverting the direction of the external magnetic field.
Finally, magnetic measurements were realized on a 3.5 × 4 mm2 piece of a 200 nm thick film with the external magnetic field applied parallel to the film surface at 300 K. These measurements are based on the extraction technique, under magnetic fields up to 5 Tesla, using a SQUID VSM. The diamagnetic signal originating from the silicon substrate was subtracted from the raw measurements.
References
Wilhelm, F. et al. Magnetic moment of Au at Au/Co interfaces: A direct experimental determination. Phys. Rev. B 69, 220404(R) (2004).
Bartolomé, J. et al. Magnetic polarization of noble metals by Co nanoparticles in M-capped granular multilayers (M = Cu, Ag, and Au): An x-ray magnetic circular dichroism study. Phys. Rev. B 77, 184420 (2008).
Wilhelm, F. et al. Au and Fe magnetic moments in disordered Au-Fe alloys. Phys. Rev. B 77, 224414 (2008).
Crespo, P. et al. Permanent Magnetism, Magnetic Anisotropy, and Hysteresis of Thiol-Capped Gold Nanoparticles. Phys. Rev. Lett. 93, 87204 (2004).
Yamamoto, Y. et al. Direct Observation of Ferromagnetic Spin Polarization in Gold Nanoparticles. Phys. Rev. Lett. 93, 116801 (2004).
Garitaonandia, J. S. et al. Chemically Induced Permanent Magnetism in Au, Ag, and Cu Nanoparticles: Localization of the Magnetism by Element Selective Techniques. Nano Lett. 2, 661–667 (2008).
Suzuki, M. et al. Measurement of a Pauli and Orbital Paramagnetic State in Bulk Gold Using X-Ray Magnetic Circular Dichroism Spectroscopy. Phys. Rev. Lett. 108, 047201 (2012).
Bartolomé, J. et al. A. Strong Paramagnetism of Gold Nanoparticles Deposited on a Sulfolobus acidocaldarius S Layer. Phys. Rev. Lett. 109, 247203 (2012).
Ando, M., Kobayashi, T. & Haruta, M. Combined effects of small gold particles on the optical gas sensing by transition metal oxide films. Catal. Today 36, 135–141 (1997).
Ohodnicki, P. R. Jr. et al. High temperature optical sensing of gas and temperature using Au-nanoparticle incorporated oxides. Sens. Act. B 202, 489–499 (2014).
Grammatikopoulos, S. et al. Growth of Au Nanoparticles in NiO via Short Annealing of Precursor Material Thin Film and Optimization of Plasmonics. Phys. Status Solidi A 214, 1700303 (2017).
Poulopoulos, P., Kapaklis, V., Politis, C., Scweiss, P. & Fuchs, D. Non-magnetic hexagonal nanocrystalline ni films grown by radio frequency magnetron sputtering. J. Nanosci. Nanotechnol. 6, 3867–70 (2006).
Kapaklis, V. et al. Structure and magnetic properties of hcp and fcc nanocrystalline thin Ni films and nanoparticles produced by radio frequency magnetron sputtering. J. Nanosci. Nanotechnol. 10, 6024 (2010).
Kleibert, A. et al. Direct observation of enhanced magnetism in individual size- and shape-selected 3d transition metal nanoparticles. Phys. Rev. B 95, 195404 (2017).
Ferreira, F. F. & Avendano, E. Reversible Electronic Charge Transfer between Au Nanoparticles and Electrochromic NiO Matrices upon Electrochemical Cycling. J. Phys. Chem. C 111, 16608–16612 (2007).
Bouldi, N. et al. X-ray magnetic and natural circular dichroism from first principles: Calculation of K- and L1-edge spectra. Phys. Rev. B 96, 085123 (2017).
Torchio, R. et al. X-Ray Magnetic Circular Dichroism Measurements in Ni up to 200 GPa: Resistant Ferromagnetism. Phys. Rev. Lett. 107, 237202 (2011).
Chaboy, J. et al. XAS and XMCD study of the influence of annealing on the atomic ordering and magnetism in an NiMnGa alloy. J. Phys.: Condens. Matter 21, 016002 (2009).
Ravikumar, P., Kisan, B. & Perumal, A. Enhanced room temperature ferromagnetism in antiferromagnetic NiO nanoparticles. AIP Advances 5, 087116 (2015).
Tyson, C. C. et al. Charge redistribution in Au-Ag alloys from a local perspective. Phys. Rev. B 45, 8924 (1992).
Goering, E., Fuss, A., Weber, W., Will, J. & Schütz, G. Element specific x-ray magnetic circular dichroism magnetization curves using total electron yield. J. Appl. Phys. 88, 5920 (2000).
Radu, F., Abrudan, R., Radu, I., Schmitz, D. & Zabel, H. Perpendicular exchange bias in ferrimagnetic spin valves. Nature Commun. 3, 715 (2012).
Vogel, J. et al. Structure and magnetism of Pd in Pd/Fe multilayers studied by x-ray magnetic circular dichroism at the Pd L2,3 sedges. Phys. Rev. B 55, 3663 (1997).
Poulopoulos, P. et al. X-ray magnetic circular dichroic magnetometry on Ni/Pt multilayers. J. Appl. Phys. 89, 3874 (2001).
Geprägs, S. et al. Investigation of induced Pt magnetic polarization in Pt/Y3Fe5O12 bilayers. Appl. Phys. Lett. 101, 262407 (2012).
Collet, M. et al. Investigating magnetic proximity effects at ferrite/Pt interfaces. Appl. Phys. Lett. 111, 202401 (2017).
Kapaklis, V. et al. Near-edge x-ray absorption fine-structure fingerprints of bulk-amorphous and nanostructured Pd-based alloys. J. Appl. Phys. 98, 044319 (2005).
Weiher, N., Willneff, E. A., Figulla-Kroschel, C., Jansen, M. & Schroeder, S. L. M. Extended X-ray absorption fine-structure (EXAFS) of a complex oxide structure: a full multiple scattering analysis of the Au L3-edge EXAFS of Au2O3. Solid State Commun. 125, 317–322 (2003).
Bazin, D., Sayers, D., Rehr, J. J. & Mottet, J. J. Numerical Simulation of the Platinum LIII Edge White Line Relative to Nanometer Scale Clusters. J. Phys. Chem. B 101, 5332–5336 (1997).
Poulopoulos, P. X-Ray magnetic circular dichroism on Pt L-edges in Co-based materials. Int. J. Mod. Phys. B 19, 4517–4523 (2005).
Rogalev, A., Wilhelm, F., Jaouen, N., Goulon, J. & Kappler, J.-P. X-ray Magnetic Circular Dichroism: Historical Perspective and Recent Highlights. In Magnetism: Synchrotron Radiation Approach ed. by Beaurepaire, E., Bulou, H., Scheurer, F. & Kappler, J.-P. Lecture Notes in Physics, Springer-Verlag, 697, 71–93 (2006).
Callister, W. D. Jr. Materials Science and Engineering: An Introduction, (ed. John Wiley & Sons, Inc.) fifth edition, chapter 18 (New York, 2000).
Issendorff, B. The electronic structure of Alkali and Noble Metal Clusters, in Handbook of Nanophysics 6, Sattler, K. (ed.), CRC-Press, (Boca Raton, 2011).
Bowlan, J., Liang, A. & de Heer, W. A. How Metallic are Small Sodium Clusters? Phys. Rev. Lett. 106, 043401 (2011).
Volokitin, Y. et al. Quantum-size effects in the thermodynamic properties of metallic nanoparticles. Nature 384, 621–623 (1996).
Petrov, I., Barna, P. B., Hultman, L. & Greene, J. E. Microstructural evolution during film growth. J. Vac. Sci. Technol. A 21, S117 (2003).
Rogalev, A., Goulon, J., Goulon-Ginet, C. & Malgrange, C. Instrumentation developments for polarization dependent x-ray spectroscopies. in Magnetism and Synchrotron Radiation ed. by Beaurepaire, E., Scheurer, F., Krill, G. & Kappler, J.-P., Lecture Notes in Physics, Springer-Verlag 565, 60–86 (2001).
Acknowledgements
We thank the ESRF crew for the excellent operational conditions. We thank Dr. A. Delimitis for the images of Ref. [11] which were helpful for this work, too. A.S acknowledges financial support for this project by the FUB. The present work was also financially supported by the “Andreas Mentzelopoulos Scholarships for the University of Patras”. This work was partially co-financed by the European Union and Greek national funds through the Operational Program Competitiveness, Entrepreneurship and Innovation, under the call RESEARCH – CREATE – INNOVATE (project code:T1EDK-04659). Electron microscopy was performed at the CMTC characterization platform of Grenoble INP supported by the Centre of Excellence of Multifunctional Architectured Materials ‘CEMAM’ No. ANR-10-LABX-44-01 funded by the “Investments for the Future” Program.
Author information
Authors and Affiliations
Contributions
A.S. and A.G. participated in the XMCD beam time. P.P. and P.F. led the project. P.P., F.W. and P.F. did the main writing of the paper. A.S. and S.G. did the sample growth. E.S. and L.R. performed the Electron Microscopy experiments. C.O. performed the SQUID VSM measurements. F.W. and A.R. are beam line scientists at ID12, ESRF and participated in the XMCD beam time. All authors carried out data analysis, participated in discussion of the results and commented on the manuscript.
Corresponding author
Ethics declarations
Competing Interests
The authors declare no competing interests.
Additional information
Publisher’s note: Springer Nature remains neutral with regard to jurisdictional claims in published maps and institutional affiliations.
Rights and permissions
Open Access This article is licensed under a Creative Commons Attribution 4.0 International License, which permits use, sharing, adaptation, distribution and reproduction in any medium or format, as long as you give appropriate credit to the original author(s) and the source, provide a link to the Creative Commons license, and indicate if changes were made. The images or other third party material in this article are included in the article’s Creative Commons license, unless indicated otherwise in a credit line to the material. If material is not included in the article’s Creative Commons license and your intended use is not permitted by statutory regulation or exceeds the permitted use, you will need to obtain permission directly from the copyright holder. To view a copy of this license, visit http://creativecommons.org/licenses/by/4.0/.
About this article
Cite this article
Stamatelatos, A., Poulopoulos, P., Goschew, A. et al. Paramagnetic gold in a highly disordered Au-Ni-O alloy. Sci Rep 9, 13137 (2019). https://doi.org/10.1038/s41598-019-49457-7
Received:
Accepted:
Published:
DOI: https://doi.org/10.1038/s41598-019-49457-7

