
Abstract
Great concern has long been raised about nitrate leaching in cropland due to its possible environmental side effects in ground water contamination. Here we employed two common techniques to measure nitrate leaching in tea plantation soils in subtropical China. Using drainage lysimeter as a reference method, the adaptability of estimating drainage and nitrate leaching by combining the water balance equation with the suction cup technique was investigated. Results showed that the final cumulative leachate volume for the calculated and measured method was 721.43 mm and 729.92 mm respectively during the study period. However, nitrate concentration exerted great influence in the estimation of nitrate leaching from the suction cup-based method. The cumulative nitrate leaching loss from the lysimeter and suction cup-based method was 47.45 kg ha−1 and 43.58 kg ha−1 under lysimeter nitrate concentrations ranging from 7 mg L−1 to 13 mg L−1, 156.28 kg ha−1 and 79.95 kg ha−1 under lysimeter nitrate concentrations exceeding 13 mg L−1. Therefore, the suction cup-based method could be an alternative way of monitoring nitrate leaching loss within a range of 7–13 mg L−1 of nitrate concentrations in leachate. Besides, lower results occurred in suction cup samplers due to lack of representative samples which mainly leached via preferential flow when in strong leaching events. Thus, it is advisable to increase sampling frequency under such special conditions. The results of this experiment can serve as a reference and guidance for the application of ceramic cups in monitoring nitrogen and other nutrient-ion leaching in tea plantation soils.
Introduction
The intensive and extensive land-use activities associated with crops and animal production cause the most substantial anthropogenic source of nitrate, among which over-use of nitrogen fertilizer is one of the most contributing factors for nitrate pollution1,2. Compared with other crops, the tea plant (Camellia sinensis) requires an elevated nitrogen supply for the growth of tea shoots to enhance tea yield and quality3,4. The mean annual N application rate ranges from 281 to 745 kg ha−1 in the main tea production provinces in China. This means about 30% of the surveyed tea gardens applied excessive chemical fertilizers according to the current recommendation5. Meanwhile, higher N input levels increased concentrations of NO3− and NH4+ in the 90–200 cm soil of the tea gardens, posing a high risk of N leaching loss in the tea gardens6. Thus, nitrate leaching from tea gardens should be of great concern for both scientists and producers.
In terms of monitoring methods for nitrate nitrogen leaching in agricultural soils, ceramic suction cup samplers and buried drainage lysimeters are the two most commonly employed techniques7. Ceramic suction cups are favored for their ease of installation and potential for repeated sampling at the same location8. They are deemed suitable for monitoring nitrate nitrogen leaching in non-structured soils9,10. However, ceramic suction cups are limited in their capacity to assess nitrate nitrogen concentrations only at specific soil depths and during particular sampling times11. This limitation makes it challenging to establish a comprehensive mass balance unless simultaneous quantification of soil water flux is undertaken. Additionally, characterized by low soil water retention and vulnerability to drought in coarse sandy soils, obtaining adequate sample volumes and capturing representative pore samples can be problematic10,12.
On the contrary, drainage lysimeters yield both the leachate volume and the nitrate nitrogen concentration, facilitating the calculation of nitrogen load passing below the defined soil layers. Other advantages embody larger sample volumes, enabling a representative sample of the soil pore network. Nonetheless, the installation and burial of drainage lysimeters traditionally introduce considerable soil disturbance, resulting in significant deviations from the original soil’s hydraulic properties and natural attributes, including the pathways for water and solute flow13. Strictly speaking, this approach constitutes a comprehensive method that integrates both temporal and spatial dimensions14. It thereby offers a more systematic and precise assessment of nitrogen leaching losses compared to other methodologies, which often capture relatively small-scale nitrogen leaching events and provide only a momentary glimpse into nitrogen leaching patterns15.
Due to the advantages and limitations inherent in both ceramic suction cup extraction and drainage lysimeter methodologies, these techniques are widely applied in empirical research. Several studies have also undertaken comparative analyses of their respective monitoring performance10,12,13. Nevertheless, extant research often relies on the ceramic suction cup approach to estimate nitrate nitrogen leaching quantities through multiplying the nitrate nitrogen concentration within the extracted solution by the measured volume obtained from the drainage lysimeter. This practice poses constraints on the application of the ceramic suction cup method, as the calculation of soil water flux becomes the key limiting factor when drainage lysimeter equipment is unavailable. Thus, it is imperative to explore alternative methods for calculating water flux and, on this basis, to conduct a comparative analysis of the two techniques. This approach is essential for promoting the practical utility and quantitative operability of the ceramic suction cup method.
Currently, there is limited research on localized nitrate nitrogen leaching in tea plantation soils, and a lack of comparative assessments of monitoring methods. In this study, we employed two methodologies, ceramic suction cup sampler and drainage lysimeters, to concurrently monitor nitrate nitrogen leaching in tea plantation soils. We put particular emphasis on the ceramic suction cup method, combined with a water balance equation, to evaluate the accuracy and efficacy of nitrate nitrogen leaching monitoring. Our objective is to provide insights and reference points for research efforts related to nitrogen leaching in tea plantation soils.
Materials and methods
Site description
The field experiment was conducted at Tea Research Institute of Chinese Academy of Agricultural Sciences (TRI-CAAS) Experimental Station in Zhejiang province of China (29.74°N, 120.82°E). The experimental site has a typical subtropical monsoon climate, with 12.6 °C in mean annual temperature and 1200 mm yr−1 in annual total precipitation. Before the experiment, tea plants (clone variety Baiye1 and Longjing43, hereafter referred to BY1 and LJ43) were planted in rows (1.5 m between rows and 0.33 m between plants) at a density of approximately 6000 plants ha−1 and allowed to grow for 4 years in the research site. The soil at the site was acidic red soil, developed from granite parent material with a texture that is clay. Before the experiment, the surface (0–20 cm) soil properties were pH 4.47, SOC 5.71 g kg−1, TN 0.47 g kg−1, available potassium (AK) 20.42 g kg−1, and low available phosphorus (AP) 1.48 g kg−1.
Experimental design
The experiment included different nitrogen (N) treatment levels, ranging from 150 kg N ha−1 to 450 kg N ha-1, with three replicates arranged in a randomized complete block design. Urea was used as the nitrogen fertilizer, and nitrogen fertilization was divided into spring (30% of the total), summer (20% of the total), and fall (50% of the total) applications. In addition to nitrogen, each plot received a one-time application of 90 kg ha−1 phosphorus (as P2O5), 120 kg ha−1 potassium (as K2O), and 1200 kg ha−1 of organic fertilizer as a basal application. The phosphorus fertilizer used was calcium superphosphate (13% P2O5), the potassium fertilizer was potassium sulfate (50% K2O), and the organic fertilizer was rapeseed cake (5% N). Fertilization was conducted during the fall season using manual trenching (10–15 cm depth). The required amount of fertilizer for each plot was evenly spread in the trench, followed by soil backfilling.
Sample collection method
Lysimeter installation and water sample collection
Drainage lysimeters were installed in July 2015 in such a way that they were collected for a representative transect of the production bed. This involved digging pits with 1.5 m length × 1 m width × 1 m height in the middle of the tea plant rows. In case of the side-seepage of soil solution, each lysimeter pit was surrounded by a piece of plastic leather before soil backfilling. Each lysimeter was paired with two 1.5-m pipes among which one was for air passage and another was fitted with a 1.0-cm butyl rubber suction tube to allow extraction of the leachate collected at the bottom of the lysimeter by a vacuum pump. leachate was regularly removed bi-weekly by applying a partial vacuum (25–30 kpa) using a 10-L vacuum bottle placed in the vacuum line for each lysimeter. Leachate volume was determined gravimetrically and subsamples were collected from each bottle for drainage and nitrate analysis. Please refer to our previous study reported by Zheng et al.16 for detailed information on the installation of lysimeters and the collection of water samples.
Soil solution extraction using ceramic suction cups
The soil solution extraction using the negative pressure ceramic suction cup method involved burying ceramic suction cups at a specific soil depth and connecting them to PVC pipes. Before sampling, a vacuum pump was used to create a vacuum inside the ceramic suction cup through the PVC pipe. This vacuum pressure allowed soil solution to be drawn into the ceramic suction cup, from which soil solution samples can then be extracted. In this experiment, ceramic suction cups were installed at a depth of 100 cm in the middle of tea rows. Four ceramic suction cups were placed horizontally at distances of − 0 cm, − 25 cm, − 50 cm, and − 75 cm from the tea tree roots. Before rainfall events, the ceramic suction cups were subjected to a vacuum pressure of approximately − 80 kPa to collect soil solution generated during rainfall. This sampling way was conducted simultaneously with the lysimeter method throughout the experiment.
Meteorological data were automatically collected by a weather station located about 100 m from the research site, and soil moisture was monitored using soil moisture sensors as described in our previous study reported by Zheng et al.16. The average temperature and rainfall during the experiment are shown in Fig. 1. It can be observed from the figure that the total rainfall for March to December 2019 and January to June 2020 was 1374.60 mm and 1095 mm, respectively. The average daily temperature fluctuated within the range of 4.97 °C to 29.18 °C, with the highest daily average temperatures occurring in July and August and the lowest temperatures often emerging in December or January. Rainfall was most abundant from June to September, while November and December experienced lower levels of rainfall.
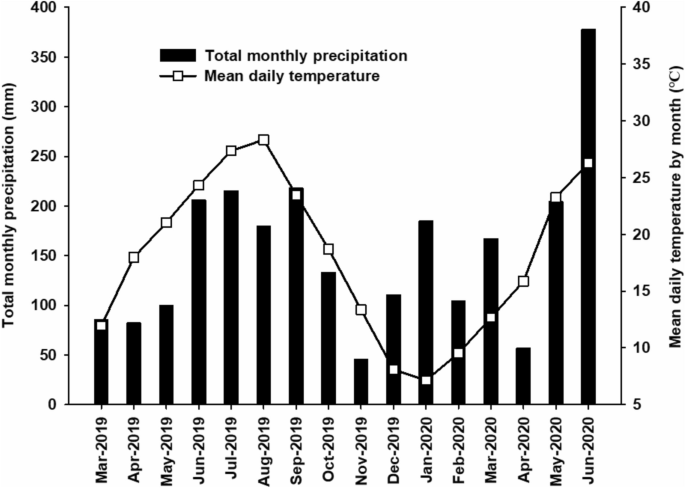
Total monthly precipitation and mean daily temperature by month from March 2019 to June 2020 at the research site.
Sample analysis and data processing
After filtering the collected soil solution and leachate samples, the nitrate nitrogen concentration, NO3−–N concentration, was determined using a UV dual-wavelength spectrophotometry method with wavelengths of 220 nm and 275 nm17,18.
For the calculation of nitrate nitrogen leaching amount (CL) from the leachate collector, it is calculated by multiplying the volume of the collected water sample by its nitrate nitrogen concentration, and the specific calculation method is as follows in Eq. (1).
where Ci is the measured NO3−–N concentration in the water sample, kg N L−1, Vi is the volume of leachate collected per extraction. The numbers 1.5 and 1.0 represent the length and width of the lysimeter, m. 0.01 is the conversion factor.
For the ceramic cup method, we need to apply a water balance equation to calculate the water flux over a specific time period. After that, you can multiply it by the concentration of nitrate nitrogen in the extracting solution to obtain the nitrate nitrogen leaching amount. The specific calculation process is as follows in Eq. (2).
The cumulative nitrate nitrogen leaching amount (CLs) for the ceramic cup method can be calculated as follows:
where Cἰ and Cἰ+1 (kg N L−1) represent the average concentrations of nitrate nitrogen in the soil-extracting solution for two consecutive sampling times. n represents the total number of sampling events.
D represents the water flux over the time interval between the two sampling events, which can be calculated using the water balance equation as shown in Eq. (3).
where P is the precipitation (mm), I means the irrigation water quantity (mm), which is not relevant in this study and is not considered in the calculations. VR is the change in soil water storage (mm). D is the leachate flux (mm). ETc is the crop evapotranspiration (mm), calculated as ETc = kc* ET0, where ET0 is the reference evapotranspiration for crops calculated from meteorological data according to FAO-56 Penman–Monteith equation19. The calculation of ET0 can be simplified as follows in Eq. (4).
where ET0 is the reference evapotranspiration (mm day−1), Rn is the net radiation at the crop surface (MJ m−2 day−1), G is the soil heat flux density (MJ m−2 day−1), T is the mean daily air temperature at 2 m height (°C), u2 is the wind speed at 2 m height (m s−1), es is the saturation vapor pressure (kPa), ea is the actual vapor pressure (kPa), (es-ea) is the saturation vapor pressure deficit (kPa), ∆ is the slope vapor pressure curve (kPa °C−1), γ psychrometric constant (kPa °C−1), and 900 is the conversion factor.
Statistical data analysis was conducted using SPSS 22 software (SPSS Inc., New York, USA). One-way analysis of variance (ANOVA) was performed, followed by Duncan's post hoc test (p < 0.05 indicates significant differences, while p < 0.01 indicates highly significant differences). All graphs were generated using Sigmaplot 12.5 software (Systat Software Inc., Milpitas, USA).
Results and discussion
Comparison of drainage flux and leachate volume calculation
During the experimental period from March 2019 to June 2020, 22 samples were taken both for BY1 and LJ43. The drainage flux for each sampling interval was calculated using the water balance equation. Based on the results from our previous study16, for BY1, Kc was set to 0.71 to calculate evapotranspiration. When the rainfall exceeded 78.02 mm, the drainage flux was fixed at the maximum value of 20.63 mm. For LJ43, Kc was set to 0.84 to calculate evapotranspiration, and when the rainfall reached or exceeded 90.98 mm, the drainage flux was fixed at the maximum value of 21.45 mm. For other rainfall levels, the drainage flux was calculated using the actual rainfall and the water balance equation. On this basis, the calculated drainage flux was compared and analyzed against the equivalent water depth calculated by converting the leachate volume extracted from the lysimeter (Lysimeter leachate). The equivalent water depth (mm) is calculated as the extracted water volume (L) divided by the lysimeter's area (1.5 m2 in this study). The results are shown in Fig. 2.

Correlation analysis of lysimeter leachate and calculated drainage (a) and comparison of cumulative leachate and cumulative calculated drainage (b) for the BY1 and LJ43 during the study period.
From Fig. 2a, it can be observed that the volume data points for both methods are distributed close to the 1:1 line, indicating that the calculated drainage flux and the lysimeter leachate volume measurements are generally in good agreement. Furthermore, the total volume sums for both methods were calculated separately (Fig. 2b). The results indicate that the cumulative calculated drainage flux for BY1 during the experimental period was 389.21 mm, slightly higher than the total lysimeter leachate volume measured at 367.77 mm. For LJ43, the total calculated drainage flux was 332.22 mm, slightly lower than the total lysimeter leachate volume of 362.15 mm. Finally, when combining all results for BY1 and LJ43, the total calculated drainage flux and the total lysimeter leachate volume were 721.43 mm and 729.92 mm, respectively, with the former only 1.16% lower than the latter. Therefore, the application of the water balance equation for soil drainage flux calculation demonstrated high accuracy and feasibility.
Comparison of soil solution and leachate nitrate nitrogen concentrations
A relationship was created with the nitrate nitrogen concentration of the lysimeter leachate during the experimental period as the x-axis and the nitrate nitrogen concentration of the soil solution extracted using the ceramic cup method as the y-axis. Additionally, a logarithmic transformation was applied to further analyze the impact of the two extraction methods on nitrate nitrogen concentration. The results are shown in Fig. 3. It can be observed in Fig. 3a that when the nitrate nitrogen concentration in the lysimeter leachate is less than 7 mg L−1, all nitrate nitrogen concentrations in the soil solution extracted from the ceramic cup method are higher than those in the lysimeter leachate. Subsequently, as the nitrate nitrogen concentration in the lysimeter leachate increases from 7 mg L−1 to 13 mg L−1, approximately half of the soil solution extracted from the ceramic cup method has a higher nitrate nitrogen concentration than the lysimeter leachate, while the other half has a lower nitrate nitrogen concentration. Then, when the nitrate nitrogen concentration in the lysimeter leachate exceeds 13 mg L−1, all soil solution extracted using the ceramic cup method has a lower nitrate nitrogen concentration than the lysimeter leachate.

Correlation between (a) nitrate concentration from lysimeter and suction cup and (b) nitrate concentration from lysimeter and logarithmic conversion value of the ratio of nitrate concentration from lysimeter to suction cup nitrate concentration.
Further analysis was conducted by taking the ratio of the nitrate nitrogen concentrations in the lysimeter leachate and the soil solution extracted using the ceramic cup method as a real number, with a base of 2 for logarithmic transformation. The trend of this transformed value with respect to the nitrate nitrogen concentration in the lysimeter leachate is shown in Fig. 3b. It is evident that as the nitrate nitrogen concentration in the lysimeter leachate increases, the logarithmic transformation value increases from its minimum value of − 3.51 to 1.93. The transformation value exhibits distinct trends and characteristics based on the grouping of nitrate nitrogen concentrations in the lysimeter leachate. When the lysimeter leachate concentration is less than 7 mg L−1, the transformation value is consistently less than 0. When the lysimeter leachate concentration exceeds 13 mg L−1, the transformation value is consistently greater than 0. However, when the lysimeter leachate concentration falls between 7 mg L−1 and 13 mg L−1, both positive and negative transformation values coexist.
Comparison of nitrate nitrogen leaching between two methods
Similarly, a relationship was created with the nitrate nitrogen concentration of the lysimeter leachate (Lysimeter method) as the x-axis and the nitrate nitrogen concentration obtained using the ceramic cup method combined with the water balance equation (Ceramic cup method) as the y-axis. Additionally, a logarithmic transformation was applied to further analyze the impact of the two methods on nitrate nitrogen leaching. The results are shown in Fig. 4. From Fig. 4a, it can be observed that when the nitrate nitrogen concentration in the lysimeter leachate is less than 7 mg L−1, almost all nitrate nitrogen leaching calculated using the ceramic cup method is higher than the nitrate nitrogen concentration in the lysimeter leachate. When the lysimeter leachate concentration falls between 7 mg L−1 and 13 mg L−1, more than half of the nitrate nitrogen leaching calculated using the ceramic cup method is lower than the lysimeter method, while the other half is higher. Then, when the lysimeter leachate concentration exceeds 13 mg L−1, all nitrate nitrogen concentrations calculated using the ceramic cup method are lower than the lysimeter leachate.

Correlation between (a) nitrate leaching from lysimeter and suction cup and (b) nitrate leaching from lysimeter and logarithmic conversion value of the ratio of nitrate leaching from lysimeter to suction cup nitrate leaching.
Further analysis was conducted by taking the ratio of the nitrate nitrogen concentrations in the lysimeter leachate and those calculated using the ceramic cup method as a real number, with a base of 2 for logarithmic transformation. The trend of this transformed value with respect to the nitrate nitrogen concentration in the lysimeter leachate is shown in Fig. 4b. It is evident that the transformation value follows a trend highly similar to the concentration transformation trend mentioned above. As the nitrate nitrogen concentration in the lysimeter leachate increases, the logarithmic transformation value increases from its minimum value of − 3.51 to 1. This transformation value exhibits distinct trends and characteristics based on the grouping of nitrate nitrogen concentrations in the lysimeter leachate. When the lysimeter leachate concentration is less than 7 mg L−1, the transformation value is consistently less than 0. When the lysimeter leachate concentration exceeds 13 mg L−1, the transformation value is consistently greater than 0. However, when the lysimeter leachate concentration falls between 7 mg L−1 and 13 mg L−1, both positive and negative transformation values coexist.
In addition, statistical analysis was performed on the total nitrate nitrogen leaching for each concentration group. The results indicate that when the lysimeter leachate concentration was less than 7 mg L−1, the total nitrate nitrogen leaching obtained by the lysimeter method and the ceramic cup method is 22.24 kg ha−1 and 44.05 kg ha−1, respectively. When the lysimeter leachate concentration fell between 7 mg L−1 and 13 mg L−1, the total nitrate nitrogen leaching calculated by the lysimeter method and the ceramic cup method was 47.45 kg ha−1 and 43.58 kg ha−1, respectively. When the lysimeter leachate concentration exceeded 13 mg L−1, the total nitrate nitrogen leaching obtained by the lysimeter method and the ceramic cup method was 156.28 kg ha−1 and 79.95 kg ha−1, respectively. In summary, there were differences in quantified nitrate nitrogen leaching losses between the two methods. If the lysimeter method was used as the standard, the ceramic cup method exhibited higher monitoring accuracy when the nitrate nitrogen concentration in the lysimeter leachate fell within the range of 7–13 mg L−1.
Discussion
Effect of rainfall on the application of the water balance model
The use of ceramic cup methods to monitor nitrate nitrogen leaching in farmland requires estimation of soil water flux through modeling. This inevitably introduces uncertainties in accurately quantifying nitrate nitrogen20. In this study, the application of a water balance model for quantitatively calculating soil drainage volume seemed to yield slightly lower water flux results compared to the corresponding measurements obtained through the lysimeter method, especially when rainfall was low (Fig. 2a). One possible reason for this discrepancy could be that the water balance equation typically accounts for only the saturated flow above field capacity, neglecting unsaturated flow. However, it is reported that unsaturated flow, which occurs at lower soil moisture levels, is more common in practice, especially when rainfall is low and soil moisture levels remain relatively low21. Therefore, it is speculated that unsaturated flow is the primary reason for the water balance model calculating lower water flux than the lysimeter measurements under these conditions.
On the other hand, for conditions with higher rainfall intensity, when applying the water balance equation to estimate water flux, it should strictly include runoff as part of the water output, with the most accurate method being the construction of runoff tanks for precise measurement. However, this study lacked the necessary means to estimate runoff, which likely led to significant deviations in the final water flux calculations. Nevertheless, previous study reported that runoff typically occurs during heavy rainfall events and increases with higher rainfall amounts22,23,24 and when a certain critical rainfall intensity is reached, water will be lost as runoff because the soil cannot absorb and retain it, and an eventual maximum leachate flux will occur25. Based on our previous study, critical rainfall amounts and maximum water leachate fluxes were determined for the tea varieties of Longjing 43 and BaiYe 1, thus mitigating the significant calculation bias arising from the absence of runoff monitoring.
Effect of soil texture on the accuracy of the suction cup-based method
The lysimeter method, being considered a relatively accurate technique for monitoring and quantifying soil nitrate nitrogen leaching, is often regarded as a true reflection of nitrate nitrogen leaching in soil26. This study indicated that when the nitrate nitrogen concentration in lysimeter leachate fell below 13 mg L-1 (especially within the range of 7–13 mg L−1), the ceramic cup method demonstrated relatively accurate monitoring results. However, when the leachate nitrate concentration exceeded 13 mg L−1, A much lower result was obtained from the ceramic cup method compared to the lysimeter method. The reason for this may rely on the soil structure. From the perspective of soil texture, this experiment was conducted in a relatively heavy clay tea plantation, where the clay content within the top meter of soil ranged from 62.53 to 69.99%16. Under such soil conditions, nitrate nitrogen is likely to be transported downward through preferential flow. Preferential flow is characterized by the rapid movement of most soil water and solutes through the large and intermediate pores of the soil, bypassing the surface soil and moving downward27. Previous studies have found that the occurrence of preferential flow was much higher in clay soils than in sandy or loamy soils28,29,30. This often resulted in higher concentrations of nitrate nitrogen in leachate water31.
Ceramic cups, on the other side, have been reported to be unsuitable for use in clayey soils because the presence of preferential flow makes it difficult for ceramic cups to effectively collect water flowing through large pores, especially during heavy rainfall events32. Additionally, Barbee and Brown (1986) compared the performance of ceramic cups and lysimeters in monitoring chloride ions in soils with three different textures. The results showed that lysimeters generally provided higher and more stable monitoring results in loam and sandy loam soils, while ceramic cups were almost ineffective in clayey soils due to the rapid leaching and movement of water through large pores. Therefore, to some extent, ceramic cups were considered to be a flawed soil solution extraction technique for clayey soils. These factors need to be considered in soil nitrate nitrogen leaching studies, especially in soil types like clay, where choosing an appropriate solution extraction method is crucial for obtaining accurate data.
Conclusions
In comparison to direct measurements using lysimeters as a reference, the feasibility of the ceramic cup's negative pressure extraction estimation method was analyzed. The results demonstrated that the total calculated drainage flux and the total measured volume for lysimeter leachate were 721.43 mm and 729.92 mm, respectively, indicating that the application of the water balance equation for estimating soil drainage flux is accurate and feasible. Furthermore, through a comparative analysis of nitrate nitrogen concentrations in water samples collected by lysimeters and ceramic cups, it was observed that the ceramic cup method exhibited a certain accuracy in estimating nitrogen leaching, especially when the nitrate nitrogen concentration in lysimeter leachate fell within the range of 7–13 mg L−1. However, under conditions of intense leaching (nitrate nitrogen concentration in lysimeter leachate exceeding 13 mg L−1), there was a risk of underestimation due to the potential lack of representative samples. Therefore, it is advisable to increase sampling frequency under such special circumstances.
Data availability
The datasets used and/or analyzed during the current study available from the corresponding author on reasonable request.
Abbreviations
- BY1:
-
Variety Baiye1
- LJ43:
-
Variety Longjing43
References
Hallberg, G. R. Nitrate in groundwater in the United States. In Nitrogen Management and Groundwater Protection (ed. Follett, R. F.) 35–74 (Elsevier, 1989).
Keeney, D. R. Sources of nitrate to ground water. CRC Crit. Rev. Environ. Contr. 16, 257–304 (1986).
Han, W. Y., Ma, L. F., Shi, Y. Z., Ruan, J. Y. & Kemmitt, S. J. Nitrogen release dynamics and transformation of slow release fertiliser products and their effects on tea yield and quality. J. Sci. Food Agric. 88, 839–846 (2008).
Han, W., Xu, J., Wei, K., Shi, Y. & Ma, L. Estimation of N2O emission from tea garden soils, their adjacent vegetable garden and forest soils in eastern China. Environ. Earth Sci. 70, 2495–2500 (2013).
Ni, K. et al. Fertilization status and reduction potential in tea gardens of China. J. Plant Nutr. Fertil. 25, 421–432 (2019).
Yan, P. et al. Tea planting affects soil acidification and nitrogen and phosphorus distribution in soil. Agric. Ecosyst. Environ. 254, 20–25 (2018).
Wey, H., Hunkeler, D., Bischoff, W. A. & Bünemann, E. K. Field-scale monitoring of nitrate leaching in agriculture: Assessment of three methods. Environ. Monit. Assess. 194, 1–20 (2022).
Creasey, C. L. & Dreiss, S. J. Porous cup samplers: Cleaning procedures and potential sample bias from trace element contamination. Soil Sci. 145, 93–101 (1988).
Webster, C. P., Shepherd, M. A., Goulding, K. W. T. & Lord, E. Comparisons of methods for measuring the leaching of mineral nitrogen from arable land. J. Soil Sci. 44, 49–62 (1993).
Barbee, G. C. & Brown, K. W. Comparison between suction and free-drainage soil solution samplers. Soil Sci. 141, 149–154 (1986).
Wolf, K. A., Pullens, J. W. & Børgesen, C. D. Optimized number of suction cups required to predict annual nitrate leaching under varying conditions in Denmark. J. Environ. Manag. 328, 116964 (2023).
Lord, E. I. & Shepherd, M. A. Developments in the use of porous ceramic cups for measuring nitrate leaching. J. Soil Sci. 44, 435–449 (1993).
Wang, Q. et al. Comparison of lysimeters and porous ceramic cups for measuring nitrate leaching in different soil types. New Zealand J. Agric. Res. 55, 333–345 (2012).
Brown, S. et al. Assessing variability of soil water balance components measured at a new lysimeter facility dedicated to the study of soil ecosystem services. J. Hydrol. 603, 127037 (2021).
Zotarelli, L., Scholberg, J. M., Dukes, M. D. & Muñoz-Carpena, R. Monitoring of nitrate leaching in sandy soils: Comparison of three methods. J. Environ. Qual. 36, 953–962 (2007).
Zheng, S. et al. Estimation of evapotranspiration and crop coefficient of rain-fed tea plants under a subtropical climate. Agronomy 11, 2332 (2021).
Norman, R. J., Edberg, J. C. & Stucki, J. W. Determination of nitrate in soil extracts by dual-wavelength ultraviolet spectrophotometry. Soil Sci. Soc. Am. J. 49, 1182–1185 (1985).
Goldman, E. & Jacobs, R. Determination of Nitrates by Ultraviolet Absorption. Am. Water Works Assoc. 53, 187–191 (1961).
Allen, R.G., Pereira, L.S., Raes, D., Smith, M. Crop Evapotranspiration-Guidelines for Computing Crop Water Requirements. FAO Irrigation and Drainage Paper 56, FAO: Rome, Italy, 1998; pp. 2–15 (1998).
Weihermüller, L. et al. In situ soil water extraction: A review. J. Environ. Qual. 36, 1735–1748 (2007).
Hu, K., Li, B., Chen, D. & White, R. E. Estimation of water percolation and nitrogen leaching in farmland: Comparison of two models. Adv. Water Sci. 15, 87–93 (2004).
Alizadehtazi, B., Gurian, P. L. & Montalto, F. A. Impact of successive rainfall events on the dynamic relationship between vegetation canopies, infiltration, and recharge in engineered urban green infrastructure systems. Ecohydrology 13, e2185 (2020).
Liu, G. et al. Interactive effects of raindrop impact and groundwater seepage on soil erosion. J. Hydrol. 578, 124066 (2019).
Wang, H. et al. Effects of rainfall intensity on groundwater recharge based on simulated rainfall experiments and a groundwater flow model. CATENA 127, 80–91 (2015).
Wang, J., Chen, L. & Yu, Z. Modeling rainfall infiltration on hillslopes using Flux-concentration relation and time compression approximation. J. Hydrol. 557, 243–253 (2018).
Sołtysiak, M. & Rakoczy, M. An overview of the experimental research use of lysimeters. Environ. Socio-Econ. Stud. 7, 49–56 (2019).
Beven, K. & Germann, P. Macropores and water flow in soils. Water Resour. Res. 18, 1311–1325 (1982).
Butters, G. L., Jury, W. A. & Ernst, F. F. Field scale transport of bromide in an unsaturated soil: 1. Experimental methodology and results. Water Resour. Res. 25, 1575–1581 (1989).
Roth, K., Jury, W. A., Flühler, H. & Attinger, W. Transport of chloride through an unsaturated field soil. Water Resour. Res. 27, 2533–2541 (1991).
Ellsworth, T. R., Jury, W. A., Ernst, F. F. & Shouse, P. J. A three-dimensional field study of solute transport through unsaturated, layered, porous media: 1. Methodology, mass recovery, and mean transport. Water Resour. Res. 27, 951–965 (1991).
Bronswijk, J. J. B., Hamminga, W. & Oostindie, K. Rapid nutrient leaching to groundwater and surface water in clay soil areas. Eur. J. Agron. 4, 431–439 (1995).
Grossmann, J., Bredemeier, M. & Udluft, P. Sorption of trace elements by suction cups of aluminum-oxide, ceramic, and plastics. Z. Pflanzenernähr. Bodenkd. 153, 359–364 (1990).
Acknowledgements
This work was financially supported by the National Key Research and Development Program of China (2022YFF0606802) and the Earmarked Fund for China Agriculture Research System (CARS-19).
Author information
Authors and Affiliations
Contributions
Conceptualization: SZ and JR; writing-original draft preparation: SZ;Writing-review and editing: KN, HC and JR; formal analysis: QN and CC; resources: HK; funding acquisition: JR. All authors have read and agreed to the published version of the manuscript.
Corresponding authors
Ethics declarations
Competing interests
The authors declare no competing interests.
Additional information
Publisher's note
Springer Nature remains neutral with regard to jurisdictional claims in published maps and institutional affiliations.
Rights and permissions
Open Access This article is licensed under a Creative Commons Attribution-NonCommercial-NoDerivatives 4.0 International License, which permits any non-commercial use, sharing, distribution and reproduction in any medium or format, as long as you give appropriate credit to the original author(s) and the source, provide a link to the Creative Commons licence, and indicate if you modified the licensed material. You do not have permission under this licence to share adapted material derived from this article or parts of it. The images or other third party material in this article are included in the article’s Creative Commons licence, unless indicated otherwise in a credit line to the material. If material is not included in the article’s Creative Commons licence and your intended use is not permitted by statutory regulation or exceeds the permitted use, you will need to obtain permission directly from the copyright holder. To view a copy of this licence, visit http://creativecommons.org/licenses/by-nc-nd/4.0/.
About this article

Cite this article
Zheng, S., Ni, K., Chai, H. et al. Comparative research on monitoring methods for nitrate nitrogen leaching in tea plantation soils. Sci Rep 14, 20747 (2024). https://doi.org/10.1038/s41598-024-71081-3
Received:
Accepted:
Published:
DOI: https://doi.org/10.1038/s41598-024-71081-3
