Abstract
Developing unconventional reservoirs through gas injection has become increasingly popular in recent years. Among the various injector gases, hydrocarbon gas is considered one of the most promising fluids for use in the EOR process. In this study, molecular dynamics simulations have been utilized to generate insights into the tight oil migration under six different hydrocarbon gas composition ratios. Simulation results indicate that the migration process of the oil-gas mixture occurs in stages, but the overall states of all systems remain relatively consistent. As the proportion of heavy components (ethane and propane) in the hydrocarbon gas increases, the threshold migration resistance of each system exhibits a pattern of initially decreasing and then increasing. The mechanism underlying the nonlinear evolutionary trend of migration resistance was clarified through analyzing dynamic interactions and interfacial tension characteristics. The essence lies in the fact that the hindrance effect caused by increasingly stronger oil/gas-pore interactions eventually outweighs the drag reduction effect induced by the gradual reduction of oil/gas-water interfacial tension. Based on migration characteristics and sensitivity factors, we propose that the optimal hydrocarbon gas composition ratio for methane/ethane/propane is in the range of 80/10/10 to 70/15/15. Overall, this study focuses on employing molecular dynamics simulations to analyze the oil-gas migration characteristics at the nanoscale, aiming to provide more detailed insights for microscopic analysis and theoretical support for tight oil development.
Introduction
With the global rise in oil consumption and the depletion of traditional oil reserves worldwide, unconventional tight oil reservoirs have attracted increased attention due to their significant development potential1,2,3. However, the limited migration and poor movability of tight oil1,4,5, resulting from these reservoirs’ low porosity and permeability, present challenges in reaping benefits through primary production6. To efficiently exploit tight oil resources, injecting a medium into the reservoir to increase formation energy, facilitate tight oil migration, and enhance oil recovery (EOR) is crucial6,7. Therefore, conducting additional research on the movability of tight oil under injection medium conditions is a logical next step.
Gas injection is widely recognized as an effective technique for displacing oil in unconventional petroleum reservoirs, particularly in tight reservoirs with nano-scale pore structures8,9,10,11. The unique properties of gases, such as their small molecular size, high diffusivity, and ability to reduce oil viscosity, make them well-suited for displacing oil from these challenging reservoirs. Laboratory experiments have shown that gas flooding (natural gas, CO2, N2), compared to water flooding, consistently results in higher recovery rates in unconventional reservoirs6. Researchers have explored the interactions of gas swelling and crude oil extraction in nanopores through molecular simulations, revealing increased miscibility of oil and gas in nano-pores. This highlights the potential of gas injection in developing unconventional reservoirs12,13,14,15.
The selection of the appropriate injection gas is crucial due to the complexity of the reservoir environment. Commonly used gases for injection include CO2, N2, and hydrocarbon gas5,6,10,16. As is well known, CO2 exhibits remarkable capabilities in reducing crude oil density, viscosity, and interfacial tension, along with displacing adsorbed components17,18,19. Relevant molecular simulation studies have also confirmed its significant swelling effect on oil14,20. However, the high production costs and potential corrosion risks to pipelines and wellbores constrain its application in the EOR process. Moreover, CO2 injection may lead to gas channeling, necessitating the use of water-soluble polymers to enhance CO2 absorption and control its movement22. On the other hand, N2 is more abundant, cost-effective, and environmentally friendly, without causing pollution or corrosion. However, the higher miscibility pressure of N2 results in lower displacement efficiency compared to CO215,23. Experimental studies have shown that N2 exhibits the lowest oil recovery rate among the gases tested within the same timeframe24.
In addition to CO2 and N2, injecting hydrocarbon gas is another significant method to enhance reservoir development5,10,25,26,27, and it is regarded as one of the most promising EOR fluids5. On the one hand, hydrocarbon gases are readily available on-site. Natural gas obtained during tight oil production can be reinjected for reuse, ensuring a stable gas source, reducing costs, and playing a positive role in carbon neutrality and greenhouse gas sequestration. On the other hand, hydrocarbon gases offer operational and availability advantages. These gases do not pollute reservoirs, do not corrode wellbores, have good injection and diffusion capabilities, and their miscibility with reservoir fluids can be adjusted. When hydrocarbon gases dissolve in oil, they significantly improve the performance of the oil phase, such as density28, and oil-water interfacial tension29,30.
In recent years, molecular dynamics simulation methods have undergone rapid development, emerging as a crucial research tool alongside theoretical and experimental approaches, and are widely regarded as a “computational microscope”. With the assistance of this method, researchers have begun exploring research on gas injection for EOR. Xiong et al. and Li et al.10,31 investigated the oil displacement behavior of four gases (CH4, C3H8, CO2, N2) in quartz and calcite nanopores using a non-equilibrium pressure diffusion method, indicating that the oil displacement capacity in both types of pores was ranked as CO2 > C3H8 > CH4 > N2. Li et al.32 employed equilibrium molecular dynamics (EMD) simulations to investigate the miscibility characteristics between oil and hydrocarbon gases (CH4, C2H6, C3H8, C4H10), finding that long-chain alkanes promote miscibility, while polar hydrocarbon components reduce the degree of miscibility. Fang et al.33 conducted research using equilibrium molecular dynamics simulations to study the dissolution of oil by different gases (CH4, C3H8, CO2, N2) in the bulk phase and on mineral surfaces, finding that the dissolution of variety gases in the bulk phase showed minimal variation, whereas the dissolution capacities on quartz surfaces followed the order: CO2 ≈ C3H8 > CH4 ≈ N2. The aforementioned studies indicate that hydrocarbon gas exhibits promising potential in enhancing oil recovery.
Although there have been advancements in the research on hydrocarbon gas injection, it remains in the preliminary exploration stage, with several issues yet to be uncovered. First, current research primarily concentrates on the static miscibility effect between hydrocarbon gas and the oil phase10,25,31,32,33, lacking investigations into the migration and movability post miscibility of gas and oil phases, particularly within nano-pores. Secondly, the existing computational simulations often employ oversimplified system frameworks, particularly evident in significant deviations between modeled oil compositions and actual component data (Single-component decane12,14,31, dodecane33, or a simple combination of a few components10,19,20,25,26,32). Finally, although our previous research indicated that the optimal gas content range for promoting migration is a methane molar ratio of 0.4–0.6 in oil34, it is important to note that hydrocarbon gas encompasses not only methane but also heavier hydrocarbon gases like ethane and propane. Laboratory and molecular simulation studies have shown that ethane and propane improve EOR performance5,34; However, the high cost of pure ethane and propane gas poses a challenge. Currently, there is a shortage of hydrocarbon gas samples with varying compositions of methane, ethane, and propane to elucidate their impact on the fluidity of tight oil.
To address the aforementioned issues, a comprehensive study on the dynamic migration behavior of tight oil through nano-pores was conducted, considering a fixed oil-gas molar ratio and six distinct ratios of hydrocarbon gas components, using molecular dynamics simulation methods. Initially, the study elucidated the dynamic process and migration resistance encountered by the oil-gas mixture within nano-pores by analyzing the force signals experienced by the oil and gas during their migration. Subsequently, by examining the microscopic interactions and the interface effects occurring during the migration of oil and gas, the study uncovered the mechanism by which variations in hydrocarbon gas composition influence changes in the migration pathway and resistance. Ultimately, by integrating the dynamic findings and characteristic analysis, a range for the relatively optimal hydrocarbon gas composition ratio was identified. This work not only enriches our understanding of oil and gas migration within nano-pores, but also provides valuable guidance for future tight oil exploration and evaluation from the perspective of molecular simulation.
Methods
Construction of molecular models
The molecular model includes a nano-pore matrix of tight reservoirs, tight oil molecules, hydrocarbon gas molecules, and water. In this work, all molecular models are constructed using Materials Studio (MS) software.
For the nano-pore matrix: following X-ray diffraction (XRD) and micro-transmission Fourier transform infrared (micro-FTIR) analyses of the mineral composition of tight reservoir rocks1,35,36,37, it was determined that clay minerals are prevalent components in tight reservoirs, constituting an average proportion of 20 ~ 50%. Kaolinite is one of the most abundant components in clay minerals, characterized by a structure composed of silica-oxygen tetrahedra and alumina-oxygen octahedra arranged in a 1:1 ratio and stacked repeatedly in space (its unit cell is Al4Si4O10(OH)8)38. The original unit cell was imported from the software library. Following cleavage and expansion, the model with a pore diameter of 6 nm and a structure size of 8.6 × 2.57 × 14.8 nm3 (X/Y/Z axis) was obtained. The pore surface is illustrated in Fig. 1a.
Regarding tight oil: tight oils are primarily composed of light oils, their density under surface conditions typically ranges from 0.80 to 0.90 g/cm339,40,41. Based on the properties and SARA (saturate, aromatic, resin, and asphaltene) characteristics of typical lacustrine tight oil in China41,42,43, a 12-component tight oil model was developed, with the selection of components based on existing literature13,44,45, which has been widely used in reservoir molecular simulations. The tight oil model consists of 65% saturated hydrocarbons, 15% aromatic hydrocarbons, and 20% resins. The molecular model of the oil components is illustrated in Fig. 1b. Previous simulation work has confirmed the rationality of the tight oil system, with a density of 0.84 g/cm3 under surface conditions46. The total number of tight oil molecules in the simulation is 732, and the number of tight oil molecules in the system is detailed in Table 1.
Regarding hydrocarbon gas: hydrocarbon gases include methane, ethane, and propane. Our previous research found that when the molar ratio of hydrocarbon gas in the oil-gas system is between 0.4 and 0.6, it optimally regulates characteristics such as migration resistance, migration rate, and oil/gas-water interfacial tension within the pores34. Based on this perspective, in the current study, we set the molar ratio of oil to gas at 0.5:0.5, which assumes that the gas ratio falls within the optimal range for migration, with the gas phase consisting of 732 molecules. Subsequently, to modify the intrinsic properties of the gas, we will adjust the proportions of different components within the gas mixture. We considered six mass ratios for methane, ethane, and propane: 100/0/0, 90/5/5, 80/10/10, 70/15/15, 60/20/20, and 50/25/25. The total number of molecules in each system may vary slightly to achieve the desired gas mass ratio, resulting in the gas molar ratio being slightly above or below 0.5. To maintain consistency in the simulation system, we used similar atomic numbers as a reference standard. The number of hydrocarbon gas molecules in each system is outlined in Table 2.
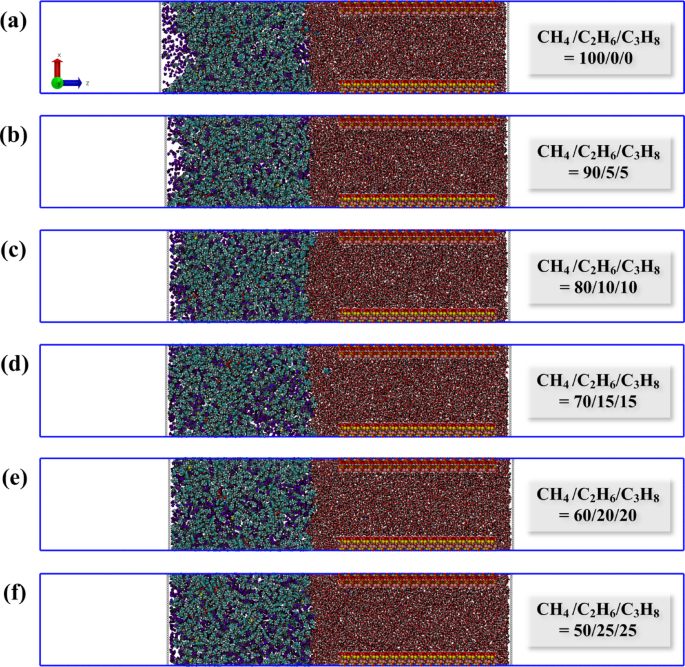
Since sedimentary rocks typically exhibit water-saturated characteristics initially47,48, filling the nano-pores with water. Following this initial setup, the oil-gas mixture system was placed on the left side of the pore structure. Two rigid pistons made of helium atoms were then introduced on both the left and right sides of the simulation system. These pistons play a crucial role in maintaining pressure within the system and creating driving pressure34,46. To ensure that the periodic boundary conditions do not interfere with fluid interactions, vacuum regions measuring 14.5 nm and 15.75 nm were added on the left and right sides of the two helium sheets, respectively. The simulation box dimensions of the system are 8.6 × 2.57 × 60 nm3 (XYZ). The initial models of the various systems can be viewed in Fig. 2.
Initial model of different hydrocarbon gas ratio systems: (a) CH4/C2H6/C3H8 = 100/0/0; (b) 90/5/5; (c) 80/10/10; (d) 70/15/15; (e) 60/20/20; (f) 50/25/25. The blue dot refers to the COM of the piston, and the red dot refers to the reference point. In order to distinguish, re-color the methane atoms. Atom color codes: violet, C in hydrocarbon gas; purple, H in hydrocarbon gas.
Force fields
The force field parameters for the kaolinite nano-pore were sourced from the CLAYFF force field47,49. The Optimized Potentials for Liquid Simulations All-Atom (OPLS-AA) force field was utilized for tight oil components and hydrocarbon gas50, while the simple point charge (SPC) model was employed for water51. The use of these three force field parameters has been validated in our previous work, ensuring the accuracy of the simulation work52,53. The interactions between oil, gas, pore surface, and water are represented by the Lennard-Jones (LJ) 12 − 6 potential and Coulomb electrostatic interactions54,
where rij represents the separation distance between atoms, εij and σij denote the LJ energy and size parameters, respectively; qi and qj are the partial charges of sites i and j; The term ε0 refers to the permittivity of vacuum. The force field parameters for all atoms are detailed in Table S1.
Simulation details
The molecular dynamics simulations were conducted using the Large-scale Atomic/Molecular Massively Parallel Simulator (LAMMPS) package55, and the dynamic trajectories and interface configurations were extracted using the Visual Molecular Dynamics (VMD) 1.9.4 software56. The simulations employed three-dimensional periodic boundary conditions with a cut-off distance of 1.2 nm and a simulation step size of 1 fs57. They were performed under the isochoric-isothermal (NVT) ensemble with the Nosé-Hoover thermostat58.
The equilibrium molecular dynamics (EMD) simulation was conducted under realistic conditions for tight reservoirs with a temperature of 353 K and a pressure of 20 MPa. The simulation duration was 4 ns. In the EMD simulation, equal but opposite forces were applied to the two pistons P1 and P2 in Fig. 2a). The migration and accumulation of tight oil are influenced by overpressure. To reveal the critical characteristics of oil-gas migration within pores, we employed a driving technique where the driving force starts from zero and gradually increases until it reaches a relative equilibrium state based on the system’s properties. This technique, known as steered molecular dynamics (SMD) simulation34,46,59,60, allows us to determine the driving pressure required for oil and gas to migrate through the pores. This method involves applying a spring force to the center of mass (COM) of the left piston to generate a driving force (P1 + F, Fig. 2a). The expression of the SMD method is shown in the equation below:
where F is the force, k is the stiffness coefficient (0.001 Kcal·mol− 1·nm− 2), Z0 is the initial position of the left piston, v is the constant velocity (0.001 nm·ps− 1) of the reference point, t is the simulation time, and Zcom is the real-time COM position of the left piston along the Z-axis in the simulation. A 13 ns SMD simulation was carried out in all systems. The flowchart of MD simulations for this study can be found in Fig. S1 of the Supplementary Information.
Results and discussion
Effects of hydrocarbon gas composition on tight oil migration
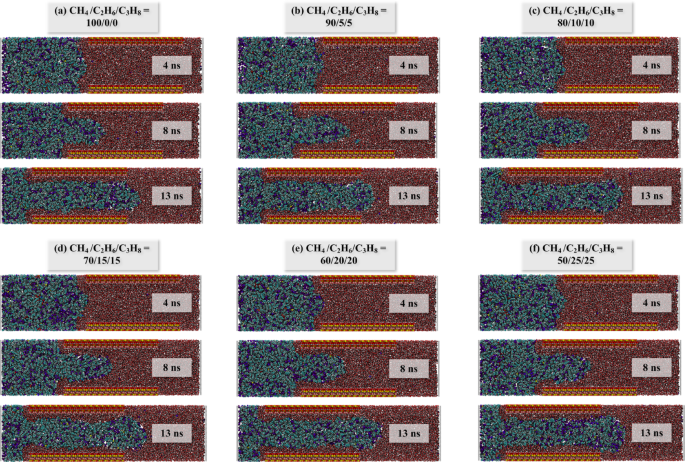
The miscibility of different hydrocarbon gas systems and tight oil under EMD simulation was observed, and the configuration of each system after EMD simulation was extracted (Fig. 3). It is observed that there is a distinct oil-gas boundary between the 100/0/0 and 90/5/5 systems (Fig. 3a, b), attributable to the high methane content in both systems. The constant pressure environment maintained in the EMD simulation is 20 MPa, whereas the miscibility pressure of methane and crude oil is also high (> 30 MPa)5, resulting in poor miscibility between the two systems. When the hydrocarbon gas ratio reaches 80/10/10, the mutual solubility of oil and gas significantly improves. As depicted in Fig. 3c–f, the gas is more uniformly distributed within the system. Consequently, during the EMD simulation phase, the presence of higher proportions of ethane and propane in the hydrocarbon gas enhances the miscibility of oil and gas.
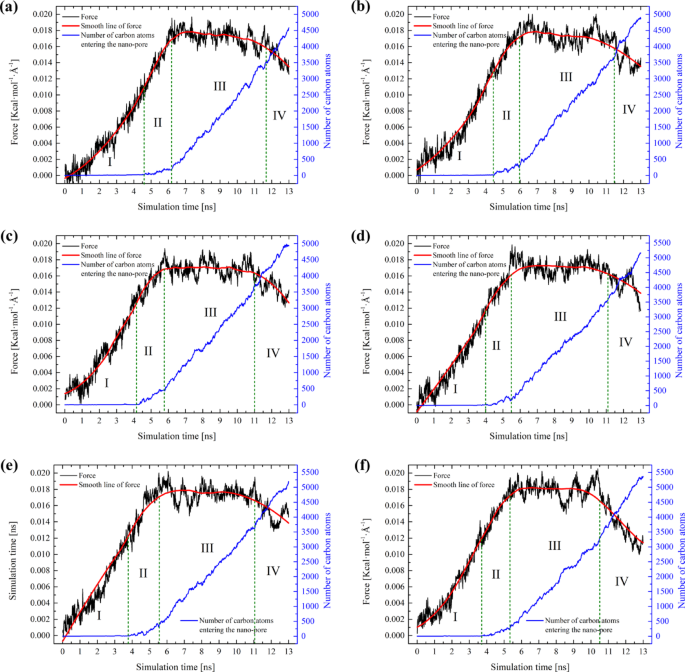
Subsequently, the results of the SMD simulations for all systems were compiled. To more accurately characterize the microscopic migration process, the spring force and the evolution of the number of carbon atoms entering the nano-pores were tracked as a function of simulation time. The force is a crucial factor that reflects the migration behavior of the system, while the number of carbon atoms entering the pore throat can, to some extent, indicate the migration rate; in other words, a greater increase in the number of carbon atoms corresponds to a faster migration rate. Given that the system is in a non-equilibrium state following the application of an external force, resulting in fluctuating forces, the spring force curve is subjected to smooth fitting (red line in Fig. 4). The force characteristics and dynamic configurations for each system are depicted in Figs. 4 and 5. By analyzing the variations in these two characteristic curves, the migration stages of each system can be distinguished.
As shown in Fig. 4, the migration process of each system is similar and can be divided into four stages. In stage I, the force for each system increases continuously, yet the number of carbon atoms entering the pore remains nearly zero. This is attributed to the self-compression of the oil-gas system upon being subjected to pressure, resulting in no actual migration. During stage II, a significant increase in force is observed, along with a slight increase in the number of carbon atoms. This is due to the oil-gas system forming a meniscus at the pore entrance, reaching a critical state for migration into the pores. Subsequently, the oil-gas system gradually passes through the pore which is labeled as stage III. Here, the force ascends to a peak and then stabilizes, exhibiting relative constancy in this stage. This indicates that the driving forces and resistance have reached an equilibrium, signifying the relaxation stage of the system. Finally, there is a decrease in force, and by examining the final configuration in Fig. 5, it is evident that this decrease is caused by the gradual expulsion of oil and gas from the pores.
In analyzing the migration process of each system, two additional distinctions can be discerned from Fig. 4. Firstly, as the proportion of ethane and propane in the hydrocarbon gas increases, the time taken for the system to attain a stable migration stage tends to decrease. Although this trend is relatively subtle, it aligns with our earlier observations. Secondly, when the spring force of the system achieves a relatively stable condition (Stage III), the oil and gas migrate steadily through the pores. The spring force during this stable phase can be considered as the threshold resistance for the migration of oil and gas. Furthermore, the threshold migration resistance for the hydrocarbon gas ratios from 100/0/0 to 50/25/25 systems has been calculated, which are 0.01744, 0.01739, 0.01699, 0.01715, 0.01745, and 0.01787 Kcal·mol− 1·Å−1, respectively (Fig. 6a). To make the values more realistic, we converted the average spring force during the stable phase (Stage III) into pressure (MPa). The corresponding threshold pressure values for each system are 33.61, 33.51, 32.74, 33.05, 33.63, and 34.44 MPa, respectively. The pressure conversion method is listed in Supplementary Information.
It can be observed that the threshold migration resistance is following the order: F50/25/25 > F60/20/20 > F100/0/0 > F90/5/5 > F70/15/15 > F80/10/10. As the proportion of ethane and propane in the hydrocarbon gas composition increases, the threshold resistance of the system initially decreases and then increases. In addition, when contrasted with the previous simulation outcomes devoid of hydrocarbon gas (0.01896 Kcal·mol− 1·Å−1, 0/0/0 in Fig. 6a)41, various hydrocarbon gas systems demonstrate a capacity to lower the migration resistance of tight oil.
By overlaying the spring force smoothing curves from all systems (Fig. 6b), it is observable that the migration rate progressively increases, and the magnitude of force during the stable migration period corresponds with the order of the preceding statistical averages. Therefore, this reduction of migration resistance does not follow a linear trend, suggesting that the composition of hydrocarbon gas inherently influences the resistance characteristics of the system.
Figure 6 (a) The threshold migration resistance of the system varies with different hydrocarbon gas ratios, with the notation 0/0/0 indicating the absence of gas in the tight oil, and this value is taken from previous research work41. It can be observed that when hydrocarbon gas is absent, the resistance encountered during the migration of tight oil is significantly higher. After converting to pressure, this value reaches as high as 36.54 MPa, which is 2–4 MPa greater than that of systems containing gas. (b) The force summary of each system.
Based on the findings of our previous research, it is evident that the migration resistance of tight oil within nano-pores is predominantly affected by the oil-pore interactions and the Jamin effect46. Consequently, we will comprehensively analyze these two aspects to elucidate the mechanisms underlying the disparities among different systems.
The microscopic interactions
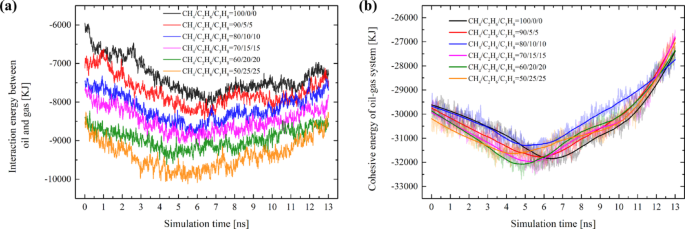
To understand the varying migration resistance across different systems, it is essential to offer reasonable insights into the microscopic fluid-solid interactions. The interaction energy between tight oil and hydrocarbon gas (Eoil−gas), the cohesive energy of oil-gas system (Ecohesive) and interaction energy between the oil-gas mixture and pore structure (Eoil/gas–pore) as a function of simulation time have been calculated (as shown in Fig. 6).
Examining the oil-gas interaction reveals that as the proportions of ethane and propane rise, the interaction between the oil and gas continues to strengthen (Fig. 6a). The stronger the Eoil−gas, the more enhanced the mutual solubility between oil and gas becomes. This also explains the phenomenon observed in the EMD simulations (Fig. 3), where better dispersion of gas within the oil system is noted when the proportion of ethane and propane exceeds 10%.
When a fluid flows, the cohesive forces between molecules resist their relative motion, generating internal friction, which hinders the fluid’s relative movement. The analysis of cohesive energy in oil-gas systems contributes to understanding the effects of cohesive forces. As shown in Fig. 6b, the evolution trend of Ecohesive is associated with the migration process of each system. During Stages I and II, the oil-gas experienced significant deformation when it was compressed from its initial position into the narrow pore, and the Ecohesive of each system increased. Once the Ecohesive of each system reaches its peak, this signals the maximum compression state of the oil-gas system (Fig. 5, approximately around the 4ns mark). The compression that occurs in Stages I and II exerts a certain resistance against migration. Subsequently, the Ecohesive of each system gradually declines and drops below the initial Ecohesive value. This implies that when the oil - gas migrates within the nano-pore, the cohesive force effect is diminished. Therefore, it can be inferred that Ecohesive is not the primary factor contributing to the resistance encountered during the oil-gas migration within the pore. Furthermore, we can observe that with the increase of ethane and propane components in the gas, there is no significant gradation in the cohesive energy of each system (Fig. 6b); all systems essentially remain at the same energy level. This also indicates that, under the current compositional adjustments, the cohesive energy of the oil-gas system may not be the primary factor influencing the differences in migration resistance.
Variations in the interaction energy of different systems during migration: (a) The interaction energy between tight oil and hydrocarbon gas. (b) The cohesive energy of oil-gas system; A negative value of interaction energy signifies an increase in energy in the negative direction, indicating an enhancement of the interaction.
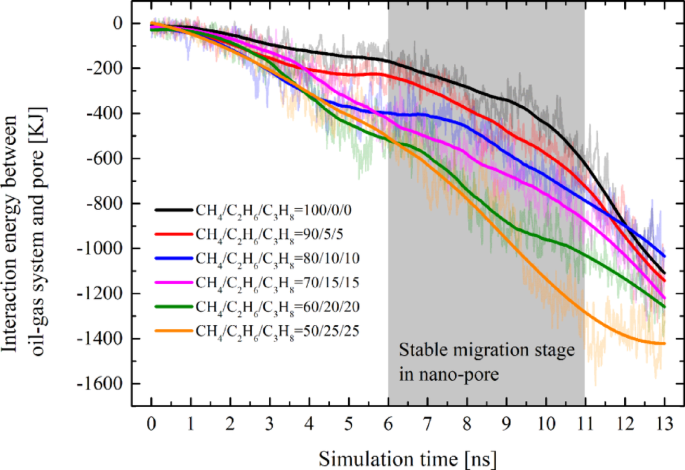
At the nanoscale, the intermolecular forces between fluids and solids are significantly enhanced, which is considered an important factor affecting the development of tight reservoirs. For interaction energy between the oil-gas mixture and pore: In all systems, the Eoil/gas–pore exhibited a trend of increment from zero as the simulation progressed. Due to significant fluctuations in the spring force before entering and after exiting the pore, the Eoil/gas–pore values for each system during stages I, II, and IV also varied considerably, resulting in poor stability. Moreover, since the threshold migration resistance of the system is solely associated with the stable migration period within the pore, our analysis focused exclusively on the Eoil/gas–pore values during the 6–11 ns interval (Stage III) for each system. Figure 7 illustrates that the energy ranking of different systems during the stable migration stage is positively correlated with the proportions of ethane and propane components (i.e. Eoil/gas−pore in different systems will be eventually in the following order: E50/25/25 > E60/20/20 > E70/15/15 > E80/10/10 > E90/5/5 > E100/0/0). Specifically, the higher the content of ethane and propane in the hydrocarbon gas, the greater the interaction energy between the oil-gas mixture and the pores. However, a higher Eoil/gas–pore indicates that the pore walls exhibit a relatively stronger adsorption effects on oil and gas. The pore walls on both sides generate a drag-like effect in the vertical direction, thereby increasing the migration resistance. Moreover, the effect of Eoil/gas−pore is also a reason why Ecohesive continuously decreases after reaching its peak. As the oil-gas system increasingly enters the pore, the attractive force from the pore wall becomes stronger, leading to a continuous weakening of the cohesive force within the oil-gas system.
It is noteworthy that changes in the system’s energy indicate alterations in the system’s state. Based on the energy curves, we can identify which energy components are at play and analyze their approximate contributions to the migration resistance. However, quantifying the exact numerical value of the resistance they produce is currently not feasible and remains an issue to be addressed in our future work.
The jamin effect
In addition to microscopic interactions, the Jamin effect61,62 also significantly influences the migration process. As the oil and gas mixture moves from a wider area into a narrow pore, the reduction in droplet diameter generates additional pressure, impeding oil and gas migration (Fig. 8). Since the mineral surface in our simulation systems is coated with an adsorbed water film, the three-phase contact angle does not exist. Consequently, the Jamin effect can be described by the following equation:
Where ΔP is the pressure of the oil and gas mixture entering the nano-pore, γ denotes the oil/gas-water interfacial tension, and R1 and R2 represent the radii of oil on the outer and inner sides of the nano-pore, respectively.
For the Jamin effect in different systems, the influencing factors include the oil/gas-water interfacial tension and the radii of the oil-gas on the inner sides of the pore. Considering that kaolinite is the sole pore matrix used in our simulation, its pore diameter and interactions with fluids remain consistent across all systems, which does not significantly impact the radius of the oil and gas mixture within the pores. Therefore, our analysis will primarily focus on the interfacial tension (IFT) between oil-gas and water.
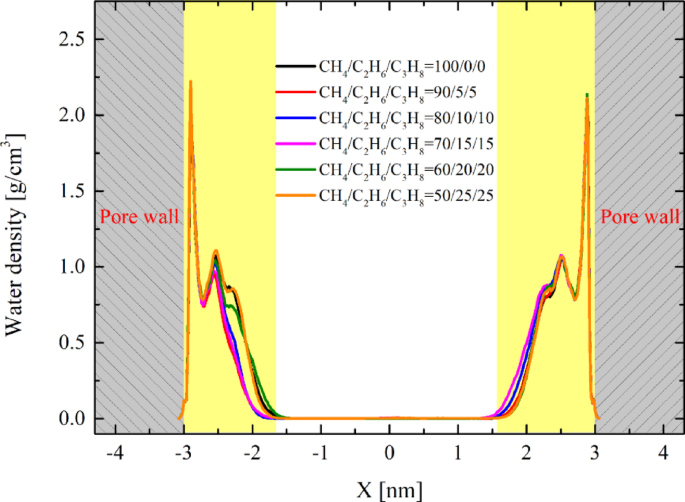
It should be noted that when fluids are confined within nanoscale pores, their properties differ significantly from those of bulk fluids. For example, in our system, an ordered layer of adsorbed water forms on the kaolinite surface, exhibiting solid-like characteristics. This phenomenon affects the surface free energy between oil and water, leading to increased IFT44,53, making IFT measurement in non-equilibrium systems extremely challenging. However, since the solid surfaces and pore sizes in our simulation system are consistent, the adsorbed water characteristics are also largely consistent. We analyzed the adsorbed water features of the six systems during the stable migration stage, as shown in Fig. 9. It can be observed that the attributes of adsorbed water exhibit fundamental consistency across different systems. Therefore, as long as the water characteristics remain consistent, we applied the principle of equivalent substitution to replace the adsorbed water on the solid surface with bulk water. In this equilibrium system, the interface is approximately uniform, allowing for highly accurate IFT simulations. The evolution trends of IFT in the bulk phase are similar to those within the pores, although the IFT values may differ from those in the pore channels. Nevertheless, we can still perform qualitative analysis based on the bulk phase simulation results.
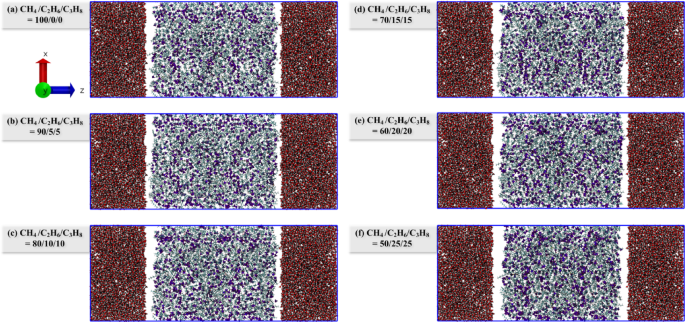
Subsequently, the bulk-phase oil/gas-water interface calculation models with different hydrocarbon gas ratios were constructed (Fig. 10). Tight oil, hydrocarbon gas, and water molecules were placed in a rectangular simulation box. At 353 K and 20 MPa, a 6 ns MD simulation was performed under the NPT ensemble to relax the system, and then a 6 ns MD simulation was performed under the NVT ensemble to collect data. Due to the oil/gas-water interfaces being parallel to the X-Y plane and perpendicular to the Z axis, the interfacial tension can be calculated by the following equation63:
where PX, PY, and PZ are the diagonal elements of the pressure tensor, and LZ is the length of the simulation box in the Z axis. The simulation results of the last 1 ns are statistically averaged.
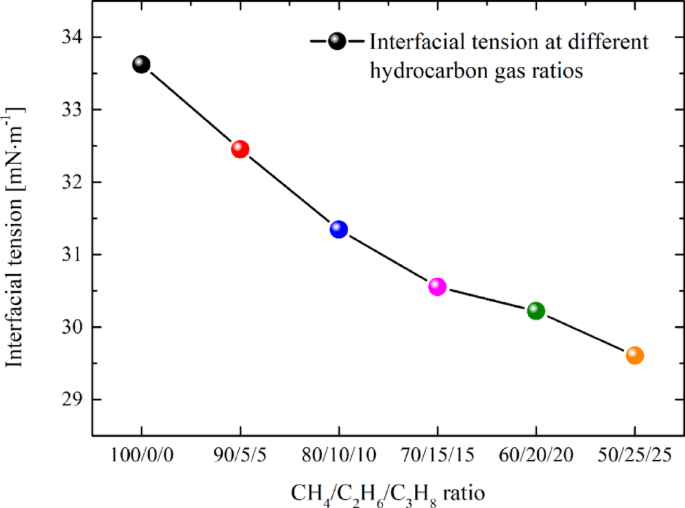
The interfacial tension values for systems with hydrocarbon gas ratios ranging from 100/0/0 to 50/25/25 have been calculated as 33.62, 32.45, 31.34, 30.55, 30.21, and 29.61 mN·m− 1, respectively. Figure 11 illustrates that the interfacial tension of different systems exhibits a continuous downward trend. Specifically, the higher the proportion of ethane and propane in the hydrocarbon gas, the lower the oil/gas-water interfacial tension. This observation aligns with our previous findings, which demonstrated that adding pure ethane and propane to tight oil significantly reduces the interfacial tension34. A reduction in interfacial tension weakens the Jamin effect, thereby decreasing the resistance encountered during migration. Meanwhile, the decreased interfacial tension facilitates the molecules at the interface to more readily overcome the mutual attraction and transition into the other phase. This is one of the reasons why the duration needed for the oil and gas system to achieve stable migration (stage III) is comparatively brief with the escalation of ethane and propane constituents in the hydrocarbon gas.
Finally, by integrating the findings on threshold migration resistance, microscopic interaction, and the Jamin effect, it becomes evident that the impact of Eoil/gas−pore and interfacial tension is unidirectional. An increase in Eoil/gas−pore impedes migration, whereas a decrease in interfacial tension facilitates it. Therefore, the threshold migration resistance initially decreases and then increases primarily due to the hindrance caused by the rise in Eoil/gas−pore outweighing the reduction in resistance from the weakening of interfacial tension.
In summary, introducing hydrocarbon gases is beneficial for reducing migration resistance and interfacial tension, thereby enhancing tight oil migration. Nevertheless, it is crucial to maintain an optimal composition of the hydrocarbon gases used. Specifically, the proportions of ethane and propane should be carefully balanced; an excessively high concentration of heavier hydrocarbons can augment the interaction with the pore system, escalating the migration resistance, while an overly low concentration can increase the oil/gas-water interfacial tension, impeding the flow and boosting the resistance. The most favorable methane/ethane/propane ratio lies between 80/10/10 and 70/15/15, at which point the migration resistance is minimized, and the oil/gas-water interfacial tension is substantially reduced.
Conclusions
In this study, we employed molecular dynamics simulations to investigate the effect of hydrocarbon gas composition on the migration of tight oil. Six distinct models were constructed, each featuring varying methane/ethane/propane mass ratios of 100/0/0, 90/5/5, 80/10/10, 70/15/15, 60/20/20, and 50/25/25, respectively. We established a pressure-driven model to elucidate oil and gas migration behaviors within kaolinite nanopores using the steered molecular dynamics technique. The conclusions are as follows:
-
(1)
The six systems exhibited similar migration characteristics, but the threshold resistance during stable migration varied. The resistance order was: F50/25/25 > F60/20/20 > F100/0/0 > F90/5/5 > F70/15/15 > F80/10/10, indicating that changes in gas composition influenced migration efficiency.
-
(2)
As the proportions of ethane and propane increase, both Eoil-gas and Eoil/gas–pore show a consistent increasing trend, while the cohesive energy (Ecohesive) of the oil-gas system does not exhibit obvious hierarchical changes. Eoil-gas reflects the mutual solubility between oil and gas. The higher the Eoil-gas, the better the mutual solubility of oil and gas. Ecohesive generates a certain resistance during the migration of the oil-gas system before it enters the pores. However, after the oil-gas enters the pores, due to the attraction from the pore walls on both sides, the increase of Eoil/gas–pore continuously weakens Ecohesive, indicating that the evolution process of Ecohesive does not significantly contribute to the resistance. Instead, the continuous increase of Eoil/gas–pore produces an effect similar to dragging, which is a major factor hindering the migration of oil and gas.
-
(3)
The resistance generated by the Jamin effect is solely related to the interfacial tension (IFT) between oil/gas and water. To avoid the influence of non-equilibrium systems and strong adsorption on the interface, we used bulk-phase simulations to analyze the IFT of each system. The results indicate that as the proportion of ethane and propane increases, the oil/gas-water IFT decreases. The reduction in IFT weakens the Jamin effect, thereby facilitating the migration of the oil-gas system.
-
(4)
The phenomenon where the critical migration resistance first decreases and then increases can be qualitatively explained by the linear evolution relationships of both enhanced Eoil/gas–pore and reduced IFT. This occurs because the resistance generated by the increasing Eoil/gas–pore ultimately surpasses the drag reduction effect caused by weakened IFT. Based on sensitivity analysis, the optimal hydrocarbon gas composition range is determined to be methane/ethane/propane ratios between 80/10/10 and 70/15/15. This range ensures relatively low oil-gas/water IFT, minimizes average migration resistance, and avoids excessive gas costs associated with higher ethane and propane proportion.
This study focuses on applying molecular dynamics methods to systematically analyze hydrocarbon migration characteristics at the nanoscale. It aims to overcome the limitations of observation challenges in traditional experimental research, provide more detailed insights for microscopic analysis, and offer theoretical support for the development of tight oil reservoirs. However, due to the complexity of reservoir geological characteristics, the limitations of computer computing power, and the deficiencies of simulation methods, current simulation techniques are still unable to comprehensively and completely reveal the migration behaviors within complex petroleum systems. In the future, it is necessary to conduct exploration in large-scale, multi-physical property simulations and cross-scale simulations. Additionally, a more comprehensive analysis of the influences of factors such as temperature, pressure, physical properties, and pore geometry should be carried out. At the same time, laboratory experiments and field experiments should be combined to verify the scalability of theoretical simulations, contributing to the tight oil EOR.
Data availability
The datasets used and/or analyzed during the current study available from the corresponding author on reasonable request.
References
Wu, S. T. et al. Distribution and characteristics of lacustrine tight oil reservoirs in China. J. Asian Earth Sci. 178, 20–36. https://doi.org/10.1016/j.jseaes.2018.05.013 (2019).
Zhao, J. Z. et al. Quasi-continuous hydrocarbon accumulation: an alternative model for the formation of large tight oil and gas accumulations. J. Petrol. Sci. Eng. 174, 25–39. https://doi.org/10.1016/j.petrol.2018.10.076 (2019).
Manfroni, M., Bukkens, S. G. F. & Giampietro, M. Securing fuel demand with unconventional oils: A metabolic perspective. Energy 261, 125256. https://doi.org/10.1016/j.energy.2022.125256 (2022).
Nelson, P. H. Pore-throat sizes in sandstones, tight sandstones, and shales. AAPG Bull. 93, 329–340. https://doi.org/10.1306/10240808059 (2009).
Burrows, L. C. et al. A literature review of CO2, natural gas, and water-based fluids for enhanced oil recovery in unconventional reservoirs. Energy Fuels. 34 (5), 5331–5380. https://doi.org/10.1021/acs.energyfuels.9b03658 (2020).
Zhou, X. et al. Evaluation of enhanced oil recovery potential using gas/water flooding in a tight oil reservoir. Fuel 272, 117706. https://doi.org/10.1016/j.fuel.2020.117706 (2020).
Zuloaga-Molero, P., Yu, W., Xu, Y., Sepehrnoori, K. & Li, B. Simulation study of CO2-EOR in tight oil reservoirs with complex fracture geometries. Sci. Rep. 6, 33115. https://doi.org/10.1038/srep33445 (2016).
Zhang, X. et al. Characterizing pore-level oil mobilization processes in unconventional reservoirs assisted by state-of-the-art nuclear magnetic resonance technique. Energy 236, 121549. https://doi.org/10.1016/j.energy.2021.121549 (2021).
Xu, Z. et al. A review of development methods and EOR technologies for carbonate reservoirs. Pet. Sci. 17, 990–1013. https://doi.org/10.1007/s12182-020-00467-5 (2020).
Wang, P. et al. The miscible behaviors and mechanism of CO2/CH4/C3H8/N2 and crude oil in Nanoslits: A molecular dynamics simulation study. Fuel 304, 121461. https://doi.org/10.1016/j.fuel.2021.121461 (2021).
Wang, S. et al. Molecular insights into carbon dioxide enhanced multi-component shale gas recovery and its sequestration in realistic kerogen. Chem. Eng. J. 425, 130292. https://doi.org/10.1016/j.cej.2021.130292 (2021).
Fang, T. M., Zhang, Y. N., Yan, Y. G., Wang, Z. Y. & Zhang, J. Molecular insight into the oil extraction and transport in CO2 flooding with reservoir depressurization. Int. J. Heat. Mass. Transf. 148, 119051. https://doi.org/10.1016/j.ijheatmasstransfer.2019.119051 (2020).
Fang, T. M., Zhang, Y. N., Ding, B., Yan, Y. G. & Zhang, J. Static and dynamic behavior of CO2 enhanced oil recovery in Nanoslits: effects of mineral type and oil components. Int. J. Heat. Mass. Transf. 153, 119583. https://doi.org/10.1016/j.ijheatmasstransfer.2020.119583 (2020).
Fang, T. M. et al. Molecular insight into the miscible mechanism of CO2/C10 in bulk phase and nanoslits. Int. J. Heat. Mass. Transf. 141, 643–650. https://doi.org/10.1016/j.ijheatmasstransfer.2019.06.083 (2019).
Fang, T. M. et al. Enhanced oil recovery with CO2/N2 slug in low permeability reservoir: molecular dynamics simulation. Chem. Eng. Sci. 197, 204–211. https://doi.org/10.1016/j.ces.2018.12.016 (2019).
Zanganeh, P., Dashti, H. & Ayatollahi, S. Comparing the effects of CH4, CO2, and N2 injection on asphaltene precipitation and deposition at reservoir condition: a visual and modeling study. Fuel 217, 633–641. https://doi.org/10.1016/j.fuel.2018.01.005 (2018).
Liu, B. et al. Displacement mechanism of oil in shale inorganic nanopores by supercritical carbon dioxide from molecular dynamics simulations. Energy Fuels. 31 (1), 738–746. https://doi.org/10.1021/acs.energyfuels.6b02377 (2017).
Assef, Y., Kantzas, A. & Pereira, A. P. Numerical modelling of Cyclic CO2 injection in unconventional tight oil resources; trivial effects of heterogeneity and hysteresis in Bakken formation. Fuel 236, 1512–1528. https://doi.org/10.1016/j.fuel.2018.09.046 (2019).
Santos, M. S., Franco, L. F., Castier, M. & Economou, I. G. Molecular dynamics simulation of n-alkanes and CO2 confined by calcite nanopores. Energy Fuels. 32 (2), 1934–1941. https://doi.org/10.1021/acs.energyfuels.7b02451 (2018).
Seyyedattar, M., Ghamartale, A., Zendehboudi, S. & Butt, S. Assessment of CO2-Oil swelling behavior using molecular dynamics simulation: CO2 utilization and storage implication. J. Mol. Liq. 379, 121582. https://doi.org/10.1016/j.molliq.2023.121582 (2023).
Macintyre, K. J. Design considerations for carbon dioxide injection facilities. J. Can. Petrol. Technol. 25, 160–168. https://doi.org/10.2118/86-02-09 (1986).
Raghav Chaturvedi, K., Kumar, R., Trivedi, J., Sheng, J. J. & Sharma, T. Stable silica nanofluids of an oilfield polymer for enhanced CO2 absorption for oilfield applications. Energy Fuels. 32 (12), 12730–12741. https://doi.org/10.1021/acs.energyfuels.8b02969 (2018).
Potoff, J. J. & Siepmann, J. I. Vapor–liquid equilibria of mixtures containing alkanes, carbon dioxide, and nitrogen. AIChE J. 47 (7), 1676–1682. https://doi.org/10.1002/aic.690470719 (2001).
Alharthy, N. et al. Enhanced oil recovery in liquid–rich shale reservoirs: laboratory to field. SPE Res. Eval Eng. 21 (01), 137–159. https://doi.org/10.2118/175034-PA (2018).
Li, X. F., Wang, S., Feng, Q. H. & Xue, Q. Z. The miscible behaviors of C10H22(C7H17N)/C3H8 system: insights from molecular dynamics simulations. Fuel 279, 118445. https://doi.org/10.1016/j.fuel.2020.118445 (2020).
Wang, S., Feng, Q. H., Javadpour, F., Hu, Q. H. & Wu, K. L. Competitive adsorption of methane and Ethane in montmorillonite nanopores of shale at supercritical conditions: A grand canonical Monte Carlo simulation study. Chem. Eng. J. 355, 76–90. https://doi.org/10.1016/j.cej.2018.08.067 (2019).
Liu, P. & Zhang, X. Enhanced oil recovery by CO2-CH4 flooding in low permeability and rhythmic hydrocarbon reservoir. Int. J. Hydrogen Energy. 40, 12849–12853. https://doi.org/10.1016/j.ijhydene.2015.07.013 (2015).
Zhang, J., Dong, Z. H., Zhang, Y. N., Wang, M. H. & Yan, Y. G. Effects of the methane content on the water-oil interface: insights from the molecular level. Energy Fuels. 31 (7), 7026–7032. https://doi.org/10.1021/acs.energyfuels.7b01001 (2017).
Amin, R. & Smith, T. N. Interfacial tension and spreading coefficient under reservoir conditions. Fluid Phase Equilib. 142 (1–2), 231–241. https://doi.org/10.1016/S0378-3812(97)00213-6 (1998).
Yang, Y. F., Nair, N., Che Ruslan, A. K. A. & Sun, M. F. Bulk and interfacial properties of the decane + water system in the presence of methane, carbon dioxide, and their mixture. J. Phys. Chem. B. 124, 9556–9569. https://doi.org/10.1021/acs.jpcb.0c05759 (2020).
Li, S. J. et al. Influence of injected gas type and reservoir conditions on the oil migration in calcite nanoslits. J. Petrol. Sci. Eng. 208, 109754. https://doi.org/10.1016/j.petrol.2021.109754 (2022).
Li, X. F., Wang, P., Wang, S., Feng, Q. H. & Xue, Q. Z. Dynamics and miscible behaviors of hydrocarbon gas and crude oil in Nanoslits: effects of light gas type and crude oil components. Chem. Eng. J. 405, 127012. https://doi.org/10.1016/j.cej.2020.127012 (2021).
Fang, T. M. et al. How the oil recovery in deep oil reservoirs is affected by injected gas types: A molecular dynamics simulation study. Chem. Eng. Sci. 231, 116286. https://doi.org/10.1016/j.ces.2020.116286 (2021).
Zhang, Y. N. et al. Molecular insights into the natural gas regulating tight oil movability. Energy 270, 126895. https://doi.org/10.1016/j.energy.2023.126895 (2023).
Jin, X. et al. Microscale comprehensive evaluation of continental shale oil recoverability. Pet. Explor. Dev. 48 (1), 256–268. https://doi.org/10.1016/S1876-3804(21)60021-6 (2021).
Chen, D. et al. Shale oil potential and mobility of low-maturity lacustrine shales: implications from NMR analysis in the Bohai Bay basin. Energy Fuels. 35 (3), 2209–2223. https://doi.org/10.1021/acs.energyfuels.0c03978 (2021).
Luo, B. et al. Mineral heterogeneity characterization of the lacustrine Yanchang shales, Ordos basin using micro-Fourier transform infrared spectroscopy (micro-FTIR) technique. Geofluids 1, 5585701. https://doi.org/10.1155/2021/5585701 (2021).
Ma, Y., Lu, G., Shao, C. & Li, X. Molecular dynamics simulation of hydrocarbon molecule adsorption on kaolinite (0 0 1) surface. Fuel 237, 989–1002. https://doi.org/10.1016/j.fuel.2018.10.063 (2019).
Yao, J. L. et al. Characteristics of tight oil in triassic Yanchang formation, Ordos basin, pet. Explor. Dev. 40, 161–169. https://doi.org/10.1016/S1876-3804(13)60019-1 (2013).
Luo, P., Luo, W. G. & Li, S. Effectiveness of miscible and immiscible gas flooding in recovering tight oil from Bakken reservoirs in Saskatchewan, Canada. Fuel 208, 626–636. https://doi.org/10.1016/j.fuel.2017.07.044 (2017).
Wang, Q. et al. Density and viscosity of tight oil from Yanchang formation, Ordos basin, China and the geochemical controls. Petrol. Sci. Technol. 36, 1298–1304. https://doi.org/10.1080/10916466.2018.1471495 (2018).
Cao, Z. et al. Lacustrine tight oil accumulation characteristics: permian Lucaogou formation in Jimusaer Sag, Junggar basin. Int. J. Coal Geol. 153, 37–51. https://doi.org/10.1016/j.coal.2015.11.004 (2016).
Cao, Z. et al. Geochemical characteristics of crude oil from a tight oil reservoir in the Lucaogou formation, Jimusar Sag, Junggar basin. AAPG Bull. 101.1, 39–72. https://doi.org/10.1306/05241614182 (2017).
Sedghi, M., Piri, M. & Goual, L. Atomistic molecular dynamics simulations of crude oil/brine displacement in calcite mesopores. Langmuir 32, 3375–3384. https://doi.org/10.1021/acs.langmuir.5b04713 (2016).
Uddin, M., Coombe, D. & Ivory, J. Quantifying physical properties of Weyburn oil via molecular dynamics simulation. Chem. Eng. J. 302, 249–259. https://doi.org/10.1016/j.cej.2016.05.050 (2016).
Zhang, Y. N. & Guo, W. Y. Molecular insight into the tight oil movability in nano-pore throat systems. Fuel 293, 120428. https://doi.org/10.1016/j.fuel.2021.120428 (2021).
Skelton, A. A., Fenter, P., Kubicki, J. D., Wesolowski, D. J. & Cummings, P. T. Simulations of the quartz (1011)/water interface: a comparison of classical force fields, Ab initio molecular dynamics, and X-ray reflectivity experiments. J. Phys. Chem. C. 115, 2076–2088. https://doi.org/10.1021/jp109446d (2011).
Yang, S., Dehghanpour, H., Binazadeh, M. & Dong, P. C. A molecular dynamics explanation for fast imbibition of oil in organic tight rocks. Fuel 190, 409–419. https://doi.org/10.1016/j.fuel.2016.10.105 (2017).
Cygan, R. T., Liang, J. J. & Kalinichev, A. G. Molecular models of hydroxide, oxyhydroxide, and clay phases and the development of a general force field. J. Phys. Chem. B. 108, 1255–1266. https://doi.org/10.1021/jp0363287 (2004).
Jorgensen, W. L., Maxwell, D. S. & Tirado-Rives, J. Development and testing of the OPLS all-atom force field on conformational energetics and properties of organic liquids. J. Am. Chem. Soc. 118, 11225–11236. https://doi.org/10.1021/ja9621760 (1996).
Berendsen, H. J. C., Grigera, J. R. & Straatsma, T. P. The missing term in effective pair potentials. J. Phys. Chem. 91, 6269–6271. https://doi.org/10.1021/j100308a038 (1987).
Zhang, Y. N. et al. Screening and verification of molecular force field based on physical property simulation of deep oil. J. China Univ. Petroleum (Edition Nat. Science). 44 (6), 162–169. https://doi.org/10.3969/j.issn.1673-5005.2020.06.021 (2020).
Zhang, Y. N. et al. Molecular insight into the oil charging mechanism in tight reservoirs. Chem. Eng. Sci. 211, 115297. https://doi.org/10.1016/j.ces.2019.115297 (2020).
Tian, Y. Y., Yan, C. H. & Jin, Z. H. Characterization of methane excess and absolute adsorption in various clay nanopores from molecular simulation. Sci. Rep. 7 (1), 12040. https://doi.org/10.1038/s41598-017-12123-x (2017).
Plimpton, S. Fast parallel algorithms for short-range molecular dynamics. J. Comput. Phys. 117, 1–19. https://doi.org/10.1006/jcph.1995.1039 (1995).
Humphrey, W., Dalke, A. & Schulten, K. VMD: visual molecular dynamics. J. Mol. Graph. 14, 33–38. https://doi.org/10.1016/0263-7855(96)00018-5 (1996).
Wang, S., Liang, Y. P., Feng, Q. H. & Javadpour, F. Sticky layers affect oil transport through the nanopores of realistic shale kerogen. Fuel 310, 122480. https://doi.org/10.1016/j.fuel.2021.122480 (2022).
Nosé, S. A molecular dynamics method for simulations in the canonical ensemble. Mol. Phys. 52, 255–268. https://doi.org/10.1080/00268978400101201 (1984).
Izrailev, S. et al. Steered molecular dynamics. Comput. Mol. Dyn. 1, 39–65. https://doi.org/10.1007/978-3-642-58360-5_2 (1999).
Yan, H. & Yuan, S. L. Molecular dynamics simulation of the oil detachment process within silica nanopores. J. Phys. Chem. C. 120, 2667–2674. https://doi.org/10.1021/acs.jpcc.5b09841 (2016).
Smith, W. O. & Crane, M. D. The jamin effect in cylindrical tubes. J. Am. Chem. Soc. 52, 1345–1349. https://doi.org/10.1021/ja01367a007 (1930).
Liang, M. C., Yang, S. S., Miao, T. J. & Yu, B. M. Minimum applied pressure for a drop through an abruptly constricted capillary. Microfluid Nanofluid. 19, 1–8. https://doi.org/10.1007/s10404-014-1541-5 (2015).
Gloor, G. J., Jackson, G., Blas, F. J. & de Miguel, E. Test-area simulation method for the direct determination of the interfacial tension of systems with continuous or discontinuous potentials. J. Chem. Phys. 123, 134703. https://doi.org/10.1063/1.2038827 (2005).
Acknowledgements
This work is financially supported by the National Natural Science Foundation of China (52404031), the Natural Science Foundation of Jiangsu Province (BK20220623, BK20241945), the Natural Science Foundation of Shandong Province (ZR202210130041), and the National Natural Science Foundation of Qingdao (23-2-1-104-zyyd-jch).
Author information
Authors and Affiliations
Contributions
Y. N. Zhang: Conceptualization, Investigation, Methodology, Formal analysis, Writing—original draft, Funding acquisition. X. J. Dou: Investigation, Resources, Funding acquisition. W. T. Zhou: Data curation, Formal analysis. C. Lu: Supervision, Writing—review & editing, Funding acquisition.
Corresponding author
Ethics declarations
Competing interests
The authors declare no competing interests.
Additional information
Publisher’s note
Springer Nature remains neutral with regard to jurisdictional claims in published maps and institutional affiliations.
Electronic supplementary material
Below is the link to the electronic supplementary material.
Rights and permissions
Open Access This article is licensed under a Creative Commons Attribution-NonCommercial-NoDerivatives 4.0 International License, which permits any non-commercial use, sharing, distribution and reproduction in any medium or format, as long as you give appropriate credit to the original author(s) and the source, provide a link to the Creative Commons licence, and indicate if you modified the licensed material. You do not have permission under this licence to share adapted material derived from this article or parts of it. The images or other third party material in this article are included in the article’s Creative Commons licence, unless indicated otherwise in a credit line to the material. If material is not included in the article’s Creative Commons licence and your intended use is not permitted by statutory regulation or exceeds the permitted use, you will need to obtain permission directly from the copyright holder. To view a copy of this licence, visit http://creativecommons.org/licenses/by-nc-nd/4.0/.
About this article
Cite this article
Zhang, Y., Dou, X., Zhou, W. et al. Molecular insights into the effect of hydrocarbon gas composition characteristics on tight oil migration. Sci Rep 15, 16970 (2025). https://doi.org/10.1038/s41598-025-02095-8
Received:
Accepted:
Published:
Version of record:
DOI: https://doi.org/10.1038/s41598-025-02095-8

