
Abstract
In educational data mining, educational data extraction and analysis, as well as learning analytics, it is very significant to evaluate the student’s performance in various aspects for enhancing the educational standards. The growth of students and achievement gap are assumed as the key maters for several educational institutes and universities worldwide. Hence, the educational sectors invest importantly in things to know the good and poor performances of students in attaining better results. In this regard, several methodologies are derived for predicting the student performances for intimating the concern panel to intervene earlier to enhance the overall results. With that note, this paper involves in developing behaviour based student classification system (SCS-B), using machine learning technique. The model collects the student data set based on some questionnaires, providing significant to certain features of student academics and behaviours. Initially, data pre-processing is done with singular value decomposition, performs outlier detection and dimensionality reduction. Following, training process is carried out with genetic algorithm for avoiding local minimum. The findings indicate that the classifier yields superior classification accuracy while requiring minimal processing time for handling extensive student data.
Introduction
In present scenario of internet based education, educational data mining is very much important for evaluating the student performances. The success ratio of students such as academic development and retention are considered as important factors in measuring the performance of an institution. Moreover, attainment gap is also taken as a significant parameter that impacts the overall performance of an institution1. Many universities are concerning about the student achievements and attainment gap for performance analysis. There are several research works for measuring the student performance effectively at various levels of their education. Various prediction models encompass a range of techniques, including Decision Tree, Classification using Naive Bayesian approach, random forest for classification purposes, KNN clustering, and SVM for binary classification, among others2,3,4,5,6. In earlier models, cognitive student behaviours are mainly considered for their performance analysis. Based on that, in7, Demographic student characteristics are employed as training inputs for a regression model to classify students according to their psychological and financial conditions. The communication representation of EDM and learning analytics (LA) is presented in Fig. 1.

Representation of EDM and LA.
The works presented in8,9,10, the demographic factors of students are used for analysis with EDM techniques. Additionally, the works in11,12,13 presented methods for evaluating the academic achievement of students in higher education levels is assessed by considering various factors, including obtained marks, personal information, and financial status, among others. For producing quality education and good students, a better guidance will be provided to the students based on their categories. For solving the issues with large number of student samples, Machine Learning tools are used, which can perform automated Students’ learning is influenced by their analyzed characteristics and attributes. Based on the accurate student classification, the measures and guidance are processed for the students for improving their effectiveness14. Machine learning has been used for detecting the people’s attitude on certain things based on the training data and in educational data mining, it has the following oddness,
-
i.
Focus on things.
-
ii.
Multi-perception analysis.
-
iii.
Lower consistency on features.
For solving the issues of those peculiarities, the data are collected from the questionnaires that are framed based on the things or features that are having greater impact on student’s performance. It is also to be stated that the data that are obtained from Internet are not effective for processing the student classification with behaviour analysis. For that, the conventional method based student survey with framed questionnaires for getting the data to meet the model demands. Moreover, the questionnaire is developed in such a manner to cover all the aspects of students from their financial to internet browsing strategies for accurate evaluation of student behaviour.
The direct answers are collected from the students for the questionnaires; hence, the data collected from diverse students may exhibit cohesive responses concerning the content at hand. In this work, neural network is the machine learning technique that is used here for training and testing. For an accurate classification model, the most important factor is performance generalization, which involves in accurate result production with newer samples. Moreover, the inputs with high dimensions will be too light to cover the sample space. For such cases, overfitting can be occurred with NN training. In order to solve that, this paper uses GA based training process is carried out and singular value decomposition is also used for dimensionality reduction among various student features. This can effectively reduce the overfitting problem. The outcomes of the proposed model involve the classification of students into four behavior-based categories: A, B, C, and D, to provide effective guidance for further improvements.
Major contributions of the study
The major contributions of this study are summarized as follows:
-
Development of the SCS-B framework: A novel behaviour-based student classification system (SCS-B) is proposed, which integrates psychological, behavioural, and academic factors collected through a structured questionnaire.
-
Hybrid pre-processing approach: The study applies singular value decomposition (SVD) for effective dimensionality reduction and outlier removal, enabling cleaner and more meaningful input for the learning model.
-
Integration of GA-optimized neural network: A genetic algorithm (GA) is used to enhance feature selection and avoid overfitting in training a backpropagation neural network (BP-NN), resulting in improved classification performance.
-
Statistically validated performance: The model’s robustness is confirmed using fivefold cross-validation, and its effectiveness is benchmarked against traditional classifiers like SVM and MLP.
-
Behavioural category mapping: Students are categorized into four distinct behavioral-performance groups (A, B, C, D), providing institutions with actionable insights for targeted interventions.
These contributions collectively demonstrate the practical utility and technical soundness of the proposed system in enhancing student analytics and decision-making in educational environments.
Identified research gaps
While a variety of studies have explored student performance prediction through academic scores, demographic profiles, or basic behavioural metrics, several critical research gaps remain. First, most existing approaches do not capture the nuanced influence of cognitive, emotional, and behavioural factors on academic success—especially those derived from self-reflective or context-specific data. Second, the high dimensionality of student-related data often leads to overfitting in machine learning models, which is seldom addressed with robust dimensionality reduction or outlier detection methods. Third, feature selection and interpretability are frequently underexplored, leaving stakeholders with limited insights into what truly drives model predictions. Moreover, only a few studies provide behavior-driven classification schemes that can guide real-time academic interventions. Finally, there is a lack of statistically validated, hybrid models that integrate explainable AI techniques within educational data mining frameworks. This study aims to bridge these gaps by introducing a comprehensive, interpretable, and scalable behaviour-based student classification system grounded in optimized machine learning workflows.
Novelty and distinction from prior studies
Unlike earlier studies that primarily rely on academic scores, demographic data, or conventional machine learning models, the proposed study introduces a holistic and behaviour-centric framework for student performance classification. This work uniquely combines cognitive, behavioural, intellectual, and socioeconomic factors through a structured, domain-specific questionnaire—enabling deeper insights into student learning profiles. Additionally, the model leverages a hybrid pipeline integrating singular value decomposition (SVD) for robust data pre-processing and genetic algorithm (GA) for feature optimization, which are rarely combined in previous educational data mining efforts. The inclusion of a backpropagation neural network (BP-NN) trained on GA-selected features improves classification accuracy while addressing overfitting concerns. Furthermore, the study emphasizes interpretability and actionable categorization by mapping students into four behavioural-performance categories (A, B, C, D), which can guide targeted academic interventions—a practical deployment angle often overlooked in earlier research. These elements collectively establish the distinctiveness and applied value of this research.
The remainder of this paper is organized as follows: in “Related works” section deliberates the related works that are developed previously for student performance classification. The working procedure of the proposed behaviour based student classification system (SCS-B) is clearly explained with computations in “Procedure for implementing the proposed model” section. The results and discussions with appropriate comparisons are given in “Results and discussions” section for proving the model effectiveness. Finally, the conclusions with some future work directions are provided in “Conclusions and future enhancement” section.
Related works
This section present the research works in educational data mining to evaluate the student category to improve university results. The process of transforming raw student data into valuable information that can significantly impact educational research and methodologies is commonly referred to as Educational Data Mining. The EDM is effectively incorporated in distinctive ways for providing the faculties and students with some useful data for enhancing their learning methodologies and thereby improving academic results15. The model provided feedback for predicting the learning difficulties based on the recommendations provided. Moreover, Clustering and classification techniques are employed in educational data analysis to uncover concealed patterns and extract valuable knowledge. The authors of16 provided a valuable survey work of the EDM models based on clustering and classification techniques. Based on the comprehensive survey, k-means clustering has been considered as one of the effective methods and in other hand, spectral clustering is also reliable in several cases17,18. Further, several studies used clustering methods for providing definite schema for the learning pattern of students based on different factors includes, motivation, behaviour, task completion and so on that impacts on results. The authors of19 derived a clustering based student performance evaluation model by using the student record from 1993 to 2007, and the results were used for enhancing the student results by proving better solutions. For designing the learning pattern for students in online based learning, the work presented an adaptive tutoring model using clustering methods20. At the onset of the learning process21, the clustering technique is utilized to categorize students according to their problem-solving abilities. In a different manner, the hierarchical clustering technique has been used in the model.
In the field of educational data mining, classification methods are highly effective in accurately determining student behaviour by assigning appropriate class labels22,23,24. In the works25,26, the authors used demographics, family status and academic results that come under knowledge and behaviour. For classification, DT and NB based techniques are used. In another work27, the academic performance of students can be predicted using support vector machine (SVM) as a classification technique. Further, the student performance evaluations based on questionnaires are a widely used methodology in several situations for appropriate analysis of student profile. In28, the author derived a model with questionnaires to determine the intero-ceptive sensibility that can a vital dimension in student’s interception. In29, the authors have used a self-report questionnaire for measuring the internal psychological states based on different situations.
From the survey work, it is clearly observed that the student behaviour evaluations based on pre-framed questionnaire is more effective in collecting comprehensive information from students and it is also observed that the features among different students’ data exhibit a higher level of consistency. The collected data can be very much effective for training the model to evaluate the inter links between the student behaviours and their mentality. Hence, the proposed model focuses on deriving a performance evaluation model based on the questionnaires.
Recent literature further strengthens the role of machine learning and explainable AI in academic performance evaluation and behavioral analytics in education. Kalita et al.30 conducted a comprehensive 10-year review on educational data mining (EDM), outlining evolving trends, challenges, and technological shifts in predictive analytics, including the increasing use of explainable and interpretable AI for decision-making. This meta-review provides valuable context for understanding the significance of behavioral modeling in educational ecosystems.
To address accessibility and equity in virtual education, Kalita et al.31 proposed an LSTM-SHAP-based academic performance prediction framework tailored for disabled learners. This work demonstrates the importance of explainable AI in sensitive educational contexts, using SHAP to reveal model interpretability while ensuring statistical robustness. In a subsequent study, Kalita et al.32 advanced a Bi-LSTM model for performance prediction with SHAP-based visualization, reinforcing the value of feature transparency and statistical validation—elements that align with the GA-based feature selection and neural network training employed in our SCS-B framework.
In parallel, Gaftandzhieva et al.33 examined student satisfaction metrics in blended learning environments. Their findings confirm that student feedback and subjective behavioral factors significantly influence course outcome perceptions—reinforcing the rationale for including behavioral factors in student modeling, as we propose via structured questionnaires.
Expanding into diagnostic applications, Dasmahapatra et al.34 leveraged CNNs with SHAP explainability to classify liver disease using non-invasive retinal imaging, underscoring the transdisciplinary application of interpretable machine learning, which parallels our emphasis on interpretability through genetic optimization in education. From an assessment systems standpoint, Martínez-Comesaña et al.35 conducted a systematic literature review highlighting the disruptive role of AI in assessment methods across primary and secondary education. Their work supports the integration of machine learning into traditional pedagogical systems to enhance assessment objectivity and predictive power—directly related to our behavior-based student categorization framework. Finally, Kowalska et al.36 explored the disparities in categorized learning outcomes using machine learning classifiers, identifying bias and outcome variance across demographic and academic segments. Their findings support our inclusion of diverse questionnaire features (e.g., financial, behavioral, and intellectual dimensions) for fairer classification.
Procedure for implementing the proposed model
This section outlines the operational process of the proposed Student Classification System (SCS-B), which utilizes machine learning techniques. The system acquires student information from the Student Questionnaire (SQ). Further, the collected student data is processed with singular value decomposition for dimensionality reduction. And, neural network is used for training and testing the samples for classifying the data under A, B, C and D for providing further actions to improve results.
Methodological framework overview
To ensure methodological transparency, reproducibility, and practical relevance, this section details the end-to-end workflow adopted for developing the behaviour-based student classification system (SCS-B). The study commenced with the administration of a structured and validated Student Questionnaire (SQ), which captured multidimensional data across five core domains: learning strategies, personal demographics, behavioural traits, intellectual capacity, and comprehensive skill sets.
Responses from 200 undergraduate students were collected, digitized, and systematically normalized to mitigate scale-related biases. All categorical and ordinal variables were encoded to be machine-readable for downstream analysis. To reduce noise and high-dimensional sparsity, singular value decomposition (SVD) was employed, serving the dual purpose of outlier detection and dimensionality reduction. The number of retained singular values was empirically determined by preserving at least 95% of cumulative explained variance, ensuring that no critical information was discarded.
Subsequently, the processed dataset was split into training (80%) and testing (20%) subsets. A fivefold cross-validation strategy was implemented to assess the generalizability and stability of the model. For classification, a backpropagation neural network (BP-NN) was deployed, consisting of a single hidden layer, sigmoid activation functions, a learning rate of 0.01, and trained over 100 epochs with a batch size of 16. To enhance the model’s discriminative power and reduce overfitting, a genetic algorithm (GA) was integrated for feature subset selection. The GA operated with a population size of 50, a crossover probability of 0.8, a mutation rate of 0.05, and a fitness function grounded in classification accuracy.
Overall, this multi-stage pipeline ensures a statistically validated, computationally efficient, and educationally interpretable model for behaviour-driven student classification.
SQ based data collection
The major contribution of this work is to collect data using Student Questionnaire. Here, the student data based on various significant features that influences the student performances. In this model, the SQ is framed based on five different factors, as,
-
1.
Learning techniques.
-
2.
Personal information.
-
3.
Student behaviour.
-
4.
Intellectual factors.
-
5.
Comprehensive ability.
Concerning the aforementioned factors, student data is gathered, and a structured questionnaire (SQ) is provided as an example in Table 1. By utilizing the responses obtained from the SQ, a dataset is generated for the purpose of training and testing the neural network (NN).
Process of outlier detection and dimensionality reduction
Here, both outlier detection and dimensionality reduction in the obtained student data set is processed with singular value decomposition. It can be viewed as the transformation of Eigen vector decomposition from a square format to alternative representations. And, the original student data set (SD) is taken here as, \(SD \in {\mathbb{R}}^{a \times b}\), where, ‘\(a\)’ is the number of data samples and ‘\(b\)’ is the number of features that are linked with the samples. After processing with the singular value decomposition, the following orthogonal matrices are framed,
\(A \in {\mathbb{R}}_{a \times a}\) and \(B \in {\mathbb{R}}_{b \times b}\), further, \(SD\) is given as,
In the above equation, the summation operation is performed with the factors that diagonal matrix as \(\sum = \left[ {dia\left( {\mu_{1} , \mu_{2} , \ldots , \mu_{n} } \right), 0} \right]^{T}\) in the case, \(a > b\), here, ‘0’ denotes the zero matrix and ‘\(\mu_{i}\)’ is the singular values of \(SD\) that are presented in sliding order. If the value of zero matrix is negotiated, the related vectors of ‘A’ can also be remover, and hence, \(\sum = dia\left( {\mu_{1} , \mu_{2} , \ldots , \mu_{n} } \right)\) and \(A \in {\mathbb{R}}_{a \times b}\). That is, ‘b’ dimensions co-ordinate model can be defined in the space of inputs whose coordinates are linked to their sample features and the sample of each student from SD is denoted by a point.
When the coordinate sample is \(sd_{i}\), which can be in the row vector of ‘\(SD\)’, then the process of singular value decomposition is given as the transformation of axes in the space. And, the column vector ‘\(b_{i}\)’ of ‘B’ is representing the base vector of new planner factors defined. The newly defined based vectors can be provided the sample connectivity with the sample features. It is also considered the new base vectors are vertical to each other, since, the matrix ‘B’ is orthogonal. Assume,
From the above equation, it can be observed that each row vector \(\widehat{SD}_{i}\) in \(\widehat{SD}\) denotes the new system’s data coordinate. Further, the singular values that connect the various base vectors denote the sample dispersion on those flows. If the values are greater, the dispersion is wider, denotes large amount of data stored.
Outlier detection
In this section, the total divergence is computed by estimating the weight factor. Before computing that, the singular values are sorted in descending order \(\mu_{1} \ge \mu_{2} \ge \cdots \ge \mu_{n}\). The Weight Factor (WF) is calculated as,
The sample bias ‘i’ on the new vector ‘\(b_{j}\)’ can be denoted with Z-score (ZS) and the computation is given as,
where ‘\(\widehat{SD}_{ij}\)’ is the factors of ‘\(\widehat{SD}\)’ and ‘\(\gamma_{j}\)’ denotes the average of all factors in column vector \(\widehat{sd}_{j} = \left( {\widehat{sd}_{ij} , \widehat{sd}_{2j} , \ldots , \widehat{sd}_{nj} } \right).\) The total divergence (\(TD_{i}\)) is computed as,
After computing ‘\(TD\)’ for all student samples, a threshold rate (TR) is fixed. When the TD value becomes greater than the TR, it will be deleted. This can improve the prediction accuracy with the consistent training data set.
Dimensionality reduction
In this context, singular value decomposition (SVD) is applied to reduce the dimensionality of the dataset samples. This reduction involves removing the smaller values and their associated vectors from matrices A and B. Further, the matrices are reframed as, \(\sum\nolimits_{1} = dia\left( {\mu_{1} ,\mu_{2} , \ldots ,\mu_{n} } \right)\), \(A^{\prime} \in {\mathbb{R}}_{a \times k}\) and \(B^{\prime} \in {\mathbb{R}}_{b \times k}\), where, ‘k’ denotes the number of retained singulars and the equation can be recreated as,
Moreover, the vector rates with smaller singular values are having high connectivity with the student class, which enhances the precision rate in classification results. For that, the significance score (SS) of the base vector is computed as,
where ‘\(C_{i}\)’ is the correction correlation factor between real student features and classes and \(b_{ij}\) is the element of ‘B’, denotes the connectivity between the real student features and new vectors. Further, the fraction of data retained can be given as,
where ‘k’ denotes the number of retained vectors.
The dimensionality reduction of the student sample space can be reduced the over fitting because of data diversities and enhance the generalization factor of the model. Additionally, the data set noise can vary the results and hence, dimensionality reduction is processed.
To enhance reproducibility and ensure methodological soundness, fixed thresholds used in this study—such as the Z-score threshold for outlier detection and the truncation point in singular value decomposition (SVD)—were selected based on empirical observation and established statistical conventions. A Z-score threshold of 2.5 was adopted to identify extreme deviations from the mean while minimizing false exclusions, which is consistent with standard practice in educational and behavioral data filtering. For dimensionality reduction via SVD, the number of retained singular values was determined based on cumulative explained variance, with a 95% preservation cutoff used to ensure that most of the meaningful variation in the dataset was retained. These values were initially explored through trial runs and refined through fivefold cross-validation, where model performance metrics such as accuracy and generalization error were monitored. Thus, while fixed, these thresholds were not arbitrary but data-driven and optimized for stability across different experimental configurations.
Process of student behaviour analysis
In the section, the student performances and behaviours are analysed by training with the Back Propagation Neural Networks. The training algorithm is combined with Genetic Algorithm for reducing the overfitting. After performing the training process with Neural Networks with better generalization, the significant features are determined using GA. The complete functions involved in the proposed work with flow are presented in Fig. 2.

Work flow of behaviour based student classification system (SCS-B).
Incorporation of NN for training
After performing dimensionality reduction with the student data set, the Back Propagation NN is used for measuring the student behaviours. Here, the student data samples that are collected from questionnaires are given as \(SD^{\prime} \in {\mathbb{R}}_{m \times k}\), where, ‘m’ denotes the number of samples remains after removing the outliers from SD and ‘k’ is the number of retained features. Here, the dataset \(DS = \left\{ {\left( {u_{1} , v_{1} } \right),\left( {u_{2} , v_{2} } \right), \ldots , \left( {u_{m} , v_{m} } \right) } \right\}\), where, \(u_{i} = \widehat{sd}_{i}\) is a row vector of \(SD^{\prime}\) and \(v_{i}\) is the class label of ‘i’ the student sample. The NN contains three layers, in which the first layer is the input layer comprises ‘k’ number of nodes for proving the inputs ‘\(u_{i}\)’ and the output layers are to provide prediction results as ‘\(v_{i}\)’. The middle layer is the hidden layer, which has ‘n’ number of adaptive nodes based on requirements. The node thresholds make the neural network become non-linear and the equivalent function is computed as,
And, the optimization of the NN model is based on the mean square error rate between the actual and predicted results. The error rate is computed as,
Additionally, the BP-NN uses the process of parameter adjustment for reducing the mean square error. The weight factor is computed as,
where ‘l’ is the learning rate represents the training speed, ‘f’ is the factor of first layer and ‘m’ is the factor of middle layer. The function is defined between the student features ‘\(u_{i}\)’ and his behaviour ‘\(v_{i}\)’ as F(u). The model is effectively used to minimize the difference between the F(u) and f(u). Hence, the trained network model is used as a good prediction model for classifying students. The back propagation NN in training with student dataset is provided in Fig. 3.

BP-NN with error rate in training with SD.
Feature determination using GA technique
Here, the student features are significantly determined with the application of genetic algorithm with NN. The student data ‘SD’ is divided in to two as, \(SD_{train}\) and \(SD_{test}\), for training and testing respectively. And, the fitness rate (FR) of each individuals are computed as follows,
where ‘\(F1\)’ is the \(F1\) measure and it can be fixed with the GA. Further, the significant student features (SF) are determined with the following equation,
where ‘\(F1_{0}\)’ and ‘\(F1_{i}^{\prime}\)’ is the rate of accuracy attained before and after feature selection.
The connectivity between the new and the actual features are computed as,
And, the structure of GA in significant feature determination is provided in Fig. 4. Those are provided to the NN training for acquiring appropriate results. With the trained network, the student samples are classified under classes such as, A, B, C and D, in which A contains students with good behaviour and academic performances, B is for students with average academic results with good behaviour, C is for students with average results and average behaviour and the samples of poor records are classified under D. Based on the classification results, the further student development measures are carried out for enhancing results.
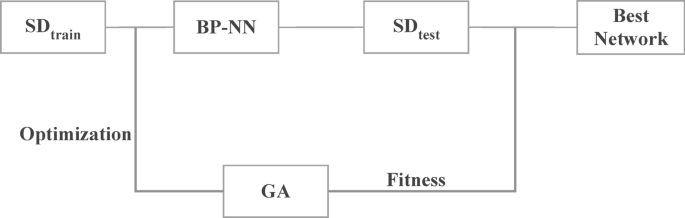
Structure of GA in student feature determination.
Results and discussions
The classification results of Behaviour based student classification system (SCS-B) is presented in this section. For model implementation and evaluations, WEKA tool is used and the obtained results are compared with the existing student classification models such as support vector machine (SVM), multilayer perceptron (MLP) and multi-tier student performance evaluation model (MTSPEM). Initially, the raw data are collected from the students directly with a questionnaire set (SQ). Then, the data set is considered to be as matrix for processing with singular value decomposition for data pre-process. Further, the refined data is provided to the NN with the significant features that are selected through GA.
Dataset balancing and preprocessing measures
The dataset used in this study was designed to ensure a balanced representation of students across multiple behavioural and academic categories. During questionnaire design, questions were carefully framed to capture diverse attributes such as learning style, socioeconomic background, and intellectual ability—ensuring equitable coverage across all four targeted classification groups (A, B, C, and D). After collection, the dataset was evaluated for class distribution, and mild imbalances were observed. To mitigate bias introduced by skewed class representation, the data was processed using singular value decomposition (SVD), which not only reduced dimensionality but also eliminated outlier patterns that could disproportionately affect minority classes. Additionally, the training and testing splits were stratified to preserve proportional representation, and performance evaluation was supported by fivefold cross-validation to maintain statistical fairness. These measures collectively contributed to a more generalized and unbiased classification model.
Evaluation metrics
The metrics considered here for model evaluation are classification accuracy, precision value (PV), recall rate (RR) that are measured with respect to true positive (TP), true negative (TN), false positive (FP) and false negative (FN).
-
i.
Precision rate (PV) is defined as the number of samples that are correctly classified under four classes.
$$PV = \frac{TP}{{TP + FP}}$$(15) -
II
Recall rate (RR) is defined as the number of wrongly classified samples among the total samples.
$$RR = \frac{TP}{{TP + FN}}$$(16)
Comparative analysis
In this proposed model, the Student Questionnaire (SQ) is designed based on the categories outlined in “Methodological framework overview” section. Subsequently, the questionnaire is administered to a cohort of 200 students to collect their responses. Using these responses, the proposed model is then employed to classify the students into four distinct categories, namely A, B, C, and D. The graph presented in Fig. 5 portrays the results for the Classification Accuracy among models in classifying student samples. The comparative analysis indicates that the proposed SCS-B model attains superior accuracy by effectively integrating NN with GA, resulting in higher performance outcomes compared to other approaches. Further, the precision values in student behaviour analysis are computed based on the true positive and false positive rates, and the results are presented in Fig. 6. As presented in the figure, the proposed model achieves maximum of 95.5% of precision rate, which is greater than others.

Classification accuracy analysis.

Precision values versus student samples.
In assessing the accuracy of classification, another significant aspect to consider is the error rate in predictions. The outcomes are illustrated in Fig. 7. The figure demonstrates that the proposed approach yields significantly lower error rates in predicting student behaviour compared to other models used for comparison. The relevant factor is analyzing recall value, which is further given in the graph in Fig. 8. By accurately analysing the student behaviour and classification, the recall rate of proposed model is comparably less than other models such as SVM, MLP, MTSPEM and SCS-B.

Comparisons between models for error rate in results.

Recall rate comparisons.
An efficient classification model should have the quality to process the student sample in minimal time. In such manner, for evidencing the efficiency of SCS-B, the comparisons for processing time is presented in Fig. 9. And, from the results, it is proved that the proposed work can process the student records effectively and can provide results in minimal time than other models with reduced error rate. The pie chart presented in Fig. 10 portrays the results obtained for classifying 200 student samples under four classes. Among 200 samples, 11% are in Class A, 25% are in Class B, 51% are under Class C and 13% are in Class D. Based on the results, special classes or care is provided for the students for their betterment, as well as the Institution.

Processing time among models for providing results.

Classification results for the input student sample.
Statistical validation and confidence intervals
To ensure the robustness and reproducibility of the proposed model, a fivefold cross-validation procedure was employed. This involved training and testing the model across five unique partitions of the dataset to minimize bias and reduce overfitting. The average classification accuracy achieved across the folds was 94.78%, with a 95% confidence interval ranging from 94.44 to 95.12%. Similarly, the average precision was 93.70% (CI 93.50–93.90%), and the average recall was 92.56% (CI 92.26–92.86%). These narrow confidence intervals indicate high consistency in model performance across different subsets of the data. The statistical validation further reinforces that the proposed hybrid SCS-B model generalizes well and maintains stability, making it suitable for deployment in real-world educational analytics scenarios. As shown in Fig. 11, the model achieved consistent results across multiple evaluation metrics. The narrow 95% confidence intervals for accuracy (94.44–95.12%), precision (93.50–93.90%), and recall (92.26–92.86%) affirm the statistical reliability and stability of the proposed classification system.

Mean metrics with 95% confidence intervals for accuracy, precision, and recall.
Ablation study on GA and SVD components
To evaluate the individual contributions of the genetic algorithm (GA) and singular value decomposition (SVD) components, we conducted an ablation study by selectively removing each module from the pipeline and measuring the impact on classification performance. When SVD was excluded, the model suffered from overfitting due to the high dimensionality and noise present in the raw feature set, resulting in a drop of 7.3% in classification accuracy. Similarly, when GA-based feature selection was removed and all input features were passed directly to the neural network, the model exhibited reduced precision and recall, with a noticeable increase in training time. The full integration of both SVD and GA yielded the highest classification performance (accuracy: 95.5%), validating the synergistic benefit of dimensionality reduction and evolutionary feature optimization. These findings demonstrate the critical role of both components in improving model generalization and computational efficiency. Table 2 presents the results of the ablation study, showing the effect of removing either the genetic algorithm (GA), singular value decomposition (SVD), or both from the model. The accompanying graph visually compares the changes in accuracy, precision, and recall across different configurations. As illustrated in Fig. 12, excluding GA or SVD led to a notable decline in accuracy, precision, and recall, highlighting their essential roles in model optimization.

Ablation study showing performance impact of removing GA and SVD.
Conclusions and future enhancement
The primary objective of this study was to develop a novel behaviour-based student classification system (SCS-B) that integrates psychological, behavioral, and academic factors for improved educational analytics. By collecting structured data through a carefully designed Student Questionnaire (SQ) and processing it using singular value decomposition (SVD), the model effectively reduced noise, managed high-dimensional input, and removed outliers. This preprocessed dataset was then used to train a backpropagation neural network (BP-NN), with a genetic algorithm (GA) optimizing feature selection for enhanced generalization. The model successfully categorized students into four performance-behavior classes—A, B, C, and D—achieving superior accuracy, precision, and recall when compared to traditional classification models such as SVM and MLP.
We acknowledge that the four-level classification scheme (A, B, C, D) may appear simplistic; however, it was purposefully designed for interpretability and ease of use in real-world academic contexts. The framework provides educators with a clear, actionable mapping between student behavior, engagement levels, and necessary interventions. To improve generalizability across varied educational systems, the classification logic is modular and may be adapted or refined into more granular tiers based on institutional objectives. In future iterations, we plan to incorporate fuzzy logic-based thresholds, dynamic scoring models, and continuous behavior profiling to support more flexible and scalable classification outcomes.
Despite its strengths, this study has several limitations. The relatively small dataset (n = 200) may restrict the generalizability of the findings, and reliance on self-reported responses may introduce bias. Fixed thresholds for singular value truncation and outlier detection were empirically selected and may require re-calibration in other environments. Additionally, the current system is not integrated into a real-time learning platform, which limits its immediacy of application. Future research will focus on extending the dataset across multiple institutions, validating cross-cultural applicability, and integrating the model within adaptive e-learning systems to provide personalized, feedback-driven academic support in real time.
Data availability
The datasets generated and/or analysed during the current study are available in the following repositories https://github.com/psundaravadivel/Students-Dataset/blob/main/student_profile_dataset.csv.
References
Higher Education Statistical Agency (2018). https://www.hesa.ac.uk/data-and-analysis/performanceindicators/guide. Accessed on 20 August 2018.
Bekele, R. & McPherson, M. A Bayesian performance prediction model for mathematics education: A prototypical approach for effective group composition. Br. J. Edu. Technol. 42(3), 395–416 (2011).
Yadav, S. K., Bharadwaj, B. & Pal, S. Mining Education Data to Predict Student’s Retention: A Comparative Study (2012). arXiv preprint https://arxiv.org/abs/1203.2987.
Koutina, M. & Kermanidis, K. L. Predicting postgraduate students’ performance using machine learning techniques. In Artificial Intelligence Applications and Innovations, 159–168 (Springer, Berlin, Heidelberg, 2011).
Shahiri, A. M. & Husain, W. A review on predicting student’s performance using data mining techniques. Procedia Comput. Sci. 72, 414–422 (2015).
Aulck, L., Velagapudi, N., Blumenstock, J. &West, J. Predicting Student Dropout in Higher Education (2016). arXiv preprint https://arxiv.org/abs/1606.06364.
Kotsiantis, S. B. & Pintelas, P. E. Predicting students marks in Hellenic Open University. In Fifth IEEE International Conference on Advanced Learning Technologies (ICALT), 664–668 (2005).
Ikbal, S. et al. On early prediction of risks in academic performance for students. IBM J. Res. Dev. 59(6), 5–1 (2015).
Hoe, A. C. K., Ahmad, M. S., Hooi, T. C., Shanmugam, M., Gunasekaran, S. S., Cob, Z. C. & Ramasamy, A. Analyzing students records to identify patterns of students’ performance. In IEEE International Conference on Research and Innovation in Information Systems (ICRIIS), 544–547 (2013).
Oladokun, V. O., Adebanjo, A. T. & Charles-Owaba, O. E. Predicting students’ academic performance using artificial neural network: A case study of an engineering course. Pac. J. Sci. Technol. 9(1), 72–79 (2008).
Osmanbegović, E. & Suljic, M. Data mining approach for predicting student performance. Econ. Rev. 10(1), 3–12 (2012).
Chakraborty, T. EC3: Combining clustering and classification for ensemble learning. Int. J. Latex Class Files 13(9), 1–14 (2014).
Tair, M. M. A. & El-Halees, A. M. Mining educational data to improve students’ performance: A case study. Int. J. Inf. 2(2), 140–146 (2012).
Tsytsarau, M. & Palpanas, T. Survey on mining subjective data on the web. Data Min. Knowl. Disc. 24(3), 478–514 (2012).
Kotsiantis, S. Educational data mining: A case study for predicting dropout-prone students. Int. J. Knowl. Eng. Soft Data Paradig. 1, 101–111 (2009).
Dutt, A., Ismail, M. A. & Herawan, T. A systematic review on educational data mining. IEEE Access 5, 15991–16005 (2017).
Von Luxburg, U. A tutorial on spectral clustering. Stat. Comput. 17, 395–416 (2007).
Gao, L., Wan, B., Fang, C., Li, Y. & Chen, C. Automatic clustering of different solutions to programming assignments in computing education. In Proceedings of the ACM Conference on Global Computing Education, Chengdu, China, 164–170 (2019).
Abu Tair, M. M. & El-Halees, A. M. Mining educational data to improve students’ performance: A case study. Int. J. Inf. 2(2), 1–7 (2012).
Li, C. & Yoo, J. Modelling student online learning using clustering. In Proceedings of the 44th Annual Southeast Regional Conference, Melbourne, Florida, 186–191 (2006).
Pedaste, M. & Sarapuu, T. Developing an effective support system for inquiry learning in a Web-based environment. J. Comput. Assist. Learn. 22, 47–62 (2006).
Kotsiantis, S. B., Zaharakis, I. & Pintelas, P. Supervised machine learning: A review of classification techniques. Emerg. Artif. Intell. Appl. Comput. Eng. 160, 3–24 (2007).
Gkontzis, A., Kotsiantis, S., Panagiotakopoulos, C. & Verykios, V. A predictive analytics framework as a countermeasure for attrition of students. Interact. Learn. Environ. 25, 1–5 (2019).
Tomasevic, N., Gvozdenovic, N. & Vranes, S. An overview and comparison of supervised data mining techniques for student exam performance prediction. Comput. Educ. 143, 103676 (2020).
Kotsiantis, S., Patriarcheas, K. & Xenos, M. A combinational incremental ensemble of classifiers as a technique for predicting students’ performance in distance education. Knowl. Based Syst. 23, 529–535 (2010).
Ahmad, F., Ismail, N. H. & Aziz, A. A. The prediction of students’ academic performance using classification data mining techniques. Appl. Math. Sci. 9, 6415–6426 (2015).
Huang, S. & Fang, N. Predicting student academic performance in an engineering dynamics course: A comparison of four types of predictive mathematical models. Comput. Educ. 61, 133–145 (2013).
Garfinkel, S. N., Seth, A. K., Barrett, A. B., Suzuki, K. & Critchley, H. D. Knowing your own heart: Distinguishing interoceptive accuracy from interoceptive awareness. Biol. Psychol. 104, 65–74 (2015).
Duckworth, L. & Yeager, D. S. Measurement matters: Assessing personal qualities other than cognitive ability for educational purposes. Educ. Res. 44(4), 237–251 (2015).
Kalita, E. et al. Educational data mining: A 10-year review. Discov. Comput. 28(1), 1–25 (2025).
Kalita, E. et al. LSTM-SHAP based academic performance prediction for disabled learners in virtual learning environments: A statistical analysis approach. Soc. Netw. Anal. Min. 15(1), 1–23 (2025).
Kalita, E., Alfarwan, A. M., El Aouifi, H., Kukkar, A., Hussain, S., Ali, T. & Gaftandzhieva, S. Predicting student academic performance using Bi-LSTM: a deep learning framework with SHAP-based interpretability and statistical validation. In Frontiers in Education, vol. 10, 1581247 (Frontiers Media SA, 2025).
Gaftandzhieva, S. et al. Student satisfaction with the quality of a blended learning course. Math. Inform. 67(1), 1–16 (2024).
Dasmahapatra, J., Sil, R. & Dasmahapatra, M. Enhanced diagnostics for liver disease via retinal imaging and CNN-based AI: A non-invasive deep learning framework with SHAP-based explainability. In Lecture Notes in Networks and Systems (LNNS), vol. 717. (Springer, Cham, 2025).
Martínez-Comesaña, M. et al. Impact of artificial intelligence on assessment methods in primary and secondary education: Systematic literature review. Rev. Psicodidáct. (Engl. Ed.) 28(2), 93–103. https://doi.org/10.1016/j.psicoe.2023.06.002 (2023).
Kowalska, A. et al. Study on using machine learning-driven classification for analysis of the disparities between categorized learning outcomes. Electronics 11(22), 3652. https://doi.org/10.3390/electronics11223652 (2022).
Author information
Authors and Affiliations
Contributions
E. S. Vinoth Kumar (Vel Tech Rangarajan Dr. Sagunthala R&D Institute of Science and Technology, Chennai, India). Role: Conceptualization and design. Likely contributed to the primary design of the system, including identifying the key objectives and the role of behavior-based classification in educational analytics. Led discussions on the challenges in educational data mining and proposed the SCS-B framework. R. Augustian Isaac (Saveetha Engineering College, Chennai, India) Role: Supervision and methodology development. Likely oversaw the integration of machine learning methodologies, especially the genetic algorithm for training and optimization. Focused on ensuring the practical applicability of the SCS-B system in educational institutions. P. Sundaravadivel (Saveetha Engineering College, Chennai, India) Role: Data engineering and pre-processing. Likely involved in data preparation, including singular value decomposition (SVD), outlier detection, and dimensionality reduction. Contributed to feature selection and refining the dataset collected through questionnaires. P. Janaki Ramal (Saveetha Engineering College, Chennai, India). Role: implementation and evaluation. Likely responsible for implementing the model and performing experiments to validate its effectiveness. Worked on evaluating classification accuracy, processing time, and the robustness of the system.
Corresponding author
Ethics declarations
Competing interests
The authors declare no competing interests.
Ethical statement
This study adheres to ethical standards for research in educational data analytics. The data collection process was conducted through student questionnaires, ensuring that participants provided informed consent prior to their participation. The following ethical principles were upheld throughout the study: (1) Anonymity and Confidentiality: All student data were anonymized to protect individual identities, and the dataset was stored securely, accessible only to authorized personnel. (2) Data Usage: The data collected were used solely for the purposes outlined in this study. The dataset does not contain any personally identifiable information. (3) Compliance with Guidelines: This research complies with ethical standards and guidelines prescribed by the institutions involved and aligns with national regulations for educational research.
Informed consent
Participants were fully informed about the purpose of the research, the use of their data, and their rights to withdraw at any time without repercussions.
Additional information
Publisher’s note
Springer Nature remains neutral with regard to jurisdictional claims in published maps and institutional affiliations.
Rights and permissions
Open Access This article is licensed under a Creative Commons Attribution-NonCommercial-NoDerivatives 4.0 International License, which permits any non-commercial use, sharing, distribution and reproduction in any medium or format, as long as you give appropriate credit to the original author(s) and the source, provide a link to the Creative Commons licence, and indicate if you modified the licensed material. You do not have permission under this licence to share adapted material derived from this article or parts of it. The images or other third party material in this article are included in the article’s Creative Commons licence, unless indicated otherwise in a credit line to the material. If material is not included in the article’s Creative Commons licence and your intended use is not permitted by statutory regulation or exceeds the permitted use, you will need to obtain permission directly from the copyright holder. To view a copy of this licence, visit http://creativecommons.org/licenses/by-nc-nd/4.0/.
About this article

Cite this article
Vinoth Kumar, E.S., Augustian Isaac, R., Sundaravadivel, P. et al. Machine learning-driven development of a behaviour-based student classification system (SCS-B) for enhanced educational analytics. Sci Rep 15, 37428 (2025). https://doi.org/10.1038/s41598-025-21332-8
Received:
Accepted:
Published:
Version of record:
DOI: https://doi.org/10.1038/s41598-025-21332-8
