
Fig. 2: Continuous glucose monitoring demonstrated glycaemic abnormalities in patients with COVID-19.
From: Acute and long-term disruption of glycometabolic control after SARS-CoV-2 infection
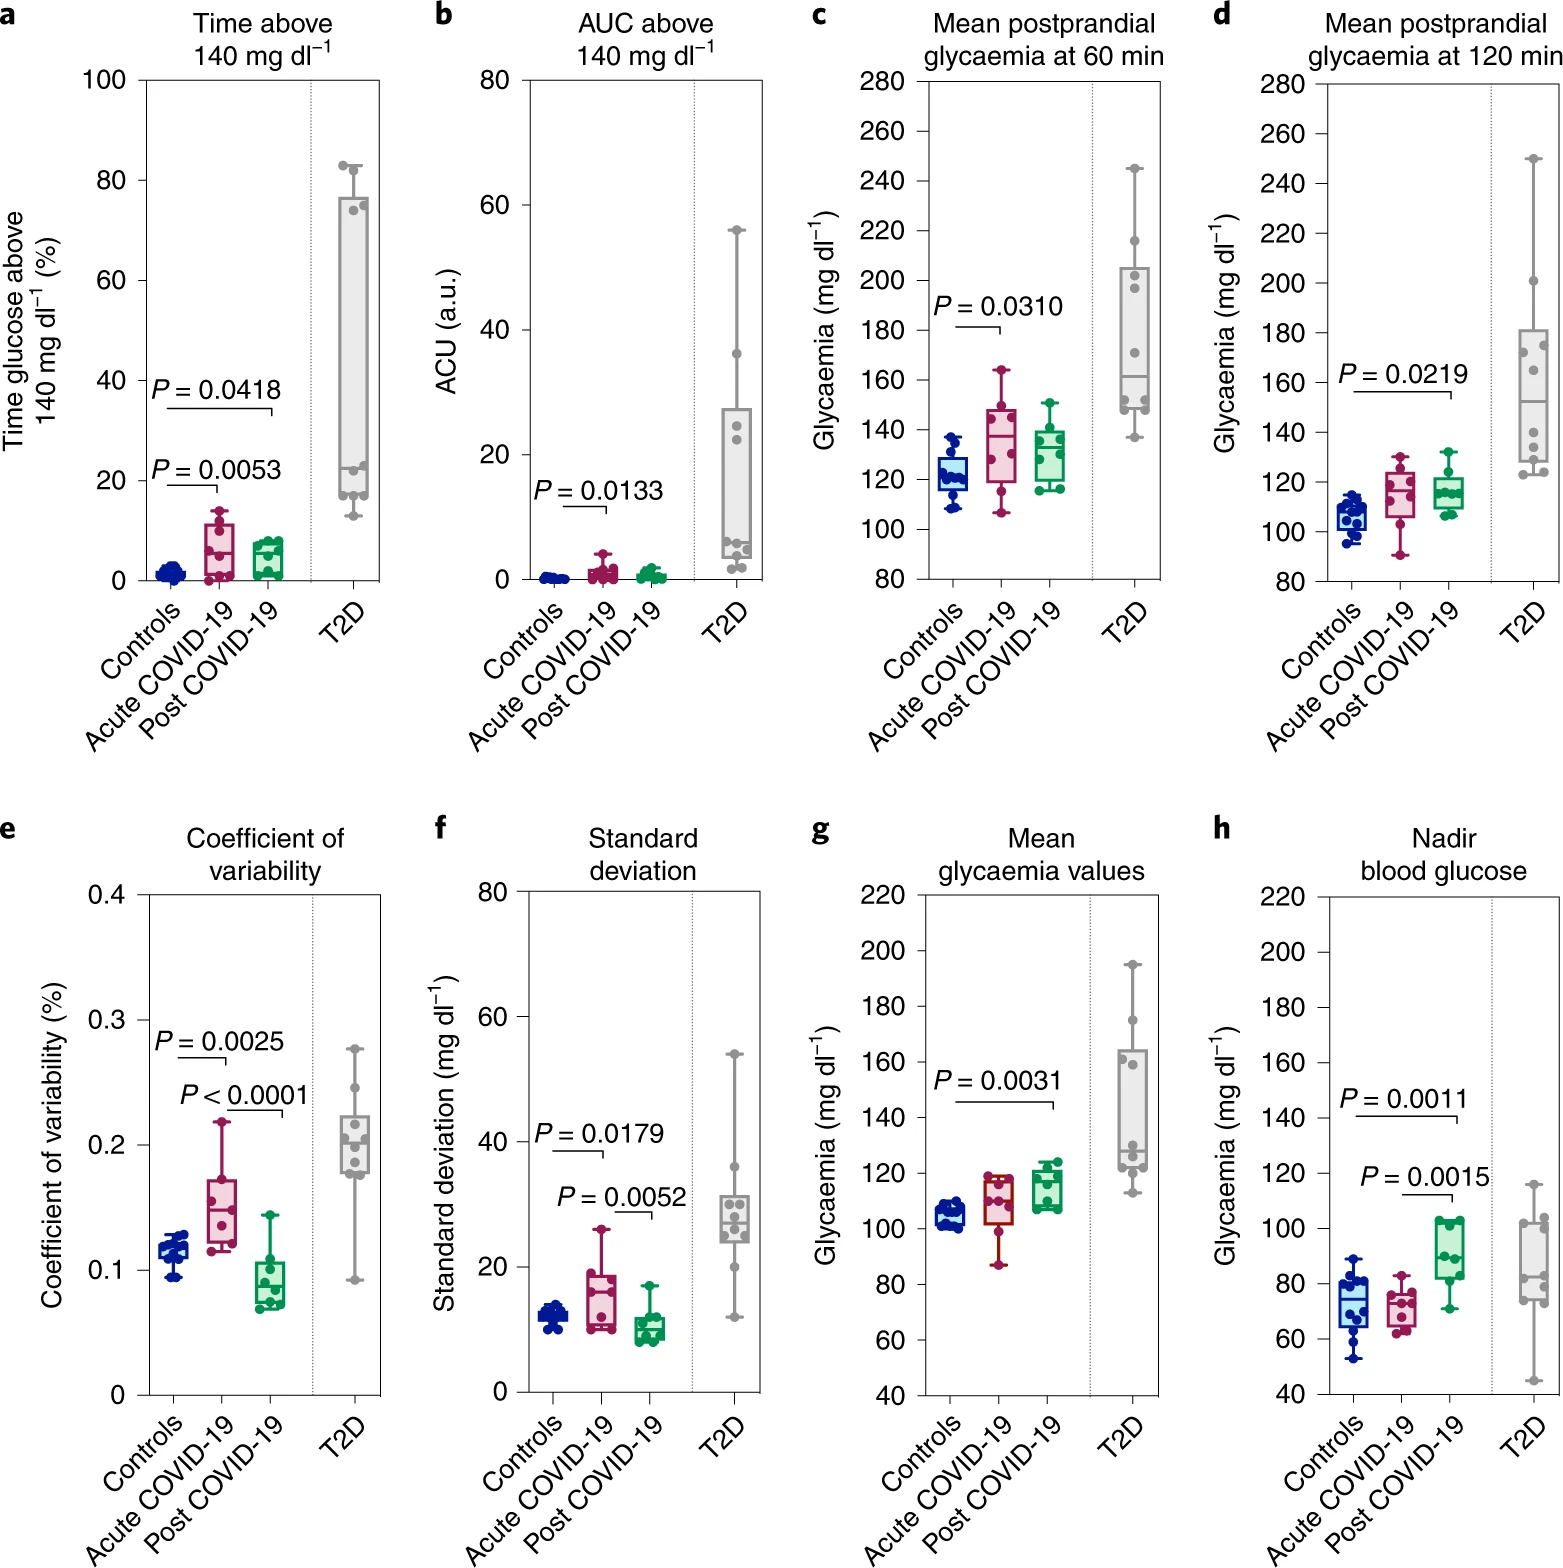
a–h, Duration of glycaemia measured above 140 mg dl−1 (a), AUC of glycaemia levels above 140 mg dl−1 (b), mean postprandial glycaemia at 60 min (c), mean postprandial glycaemia at 120 min (d), coefficient of variability (e), standard deviation (f), mean glycaemia values (g) and nadir blood glucose (h) in healthy controls, in patients with COVID-19 (acute COVID-19), in patients who recovered from COVID-19 (post COVID-19) and in patients with T2D. Data are depicted using box plots and whiskers where the upper and lower bounds of the boxes represent the interquartile ranges. The horizontal line inside each box reflects the median, and the whiskers indicate minimum and maximum values. Each dot represents an individual sample (controls (blue), COVID-19 (maroon) and post COVID-19 (moss)). Ordinary one-way ANOVA test with Bonferroni correction was used when applicable for calculating statistical significance between all groups. Data are representative of n = 12 samples for controls, n = 8 (except for e; n = 7) for acute COVID-19, n = 8 for post COVID-19 and n = 10 for patients with T2D. T2D group (grey) was not included in the statistical analysis and is shown for visual comparison only. a.u., arbitrary units.
