
Fig. 3: Annual average surface air temperatures for selected ages at 210 Ma, 170 Ma, 130 Ma, 90 Ma and 40 Ma.
From: Polar wander leads to large differences in past climate reconstructions
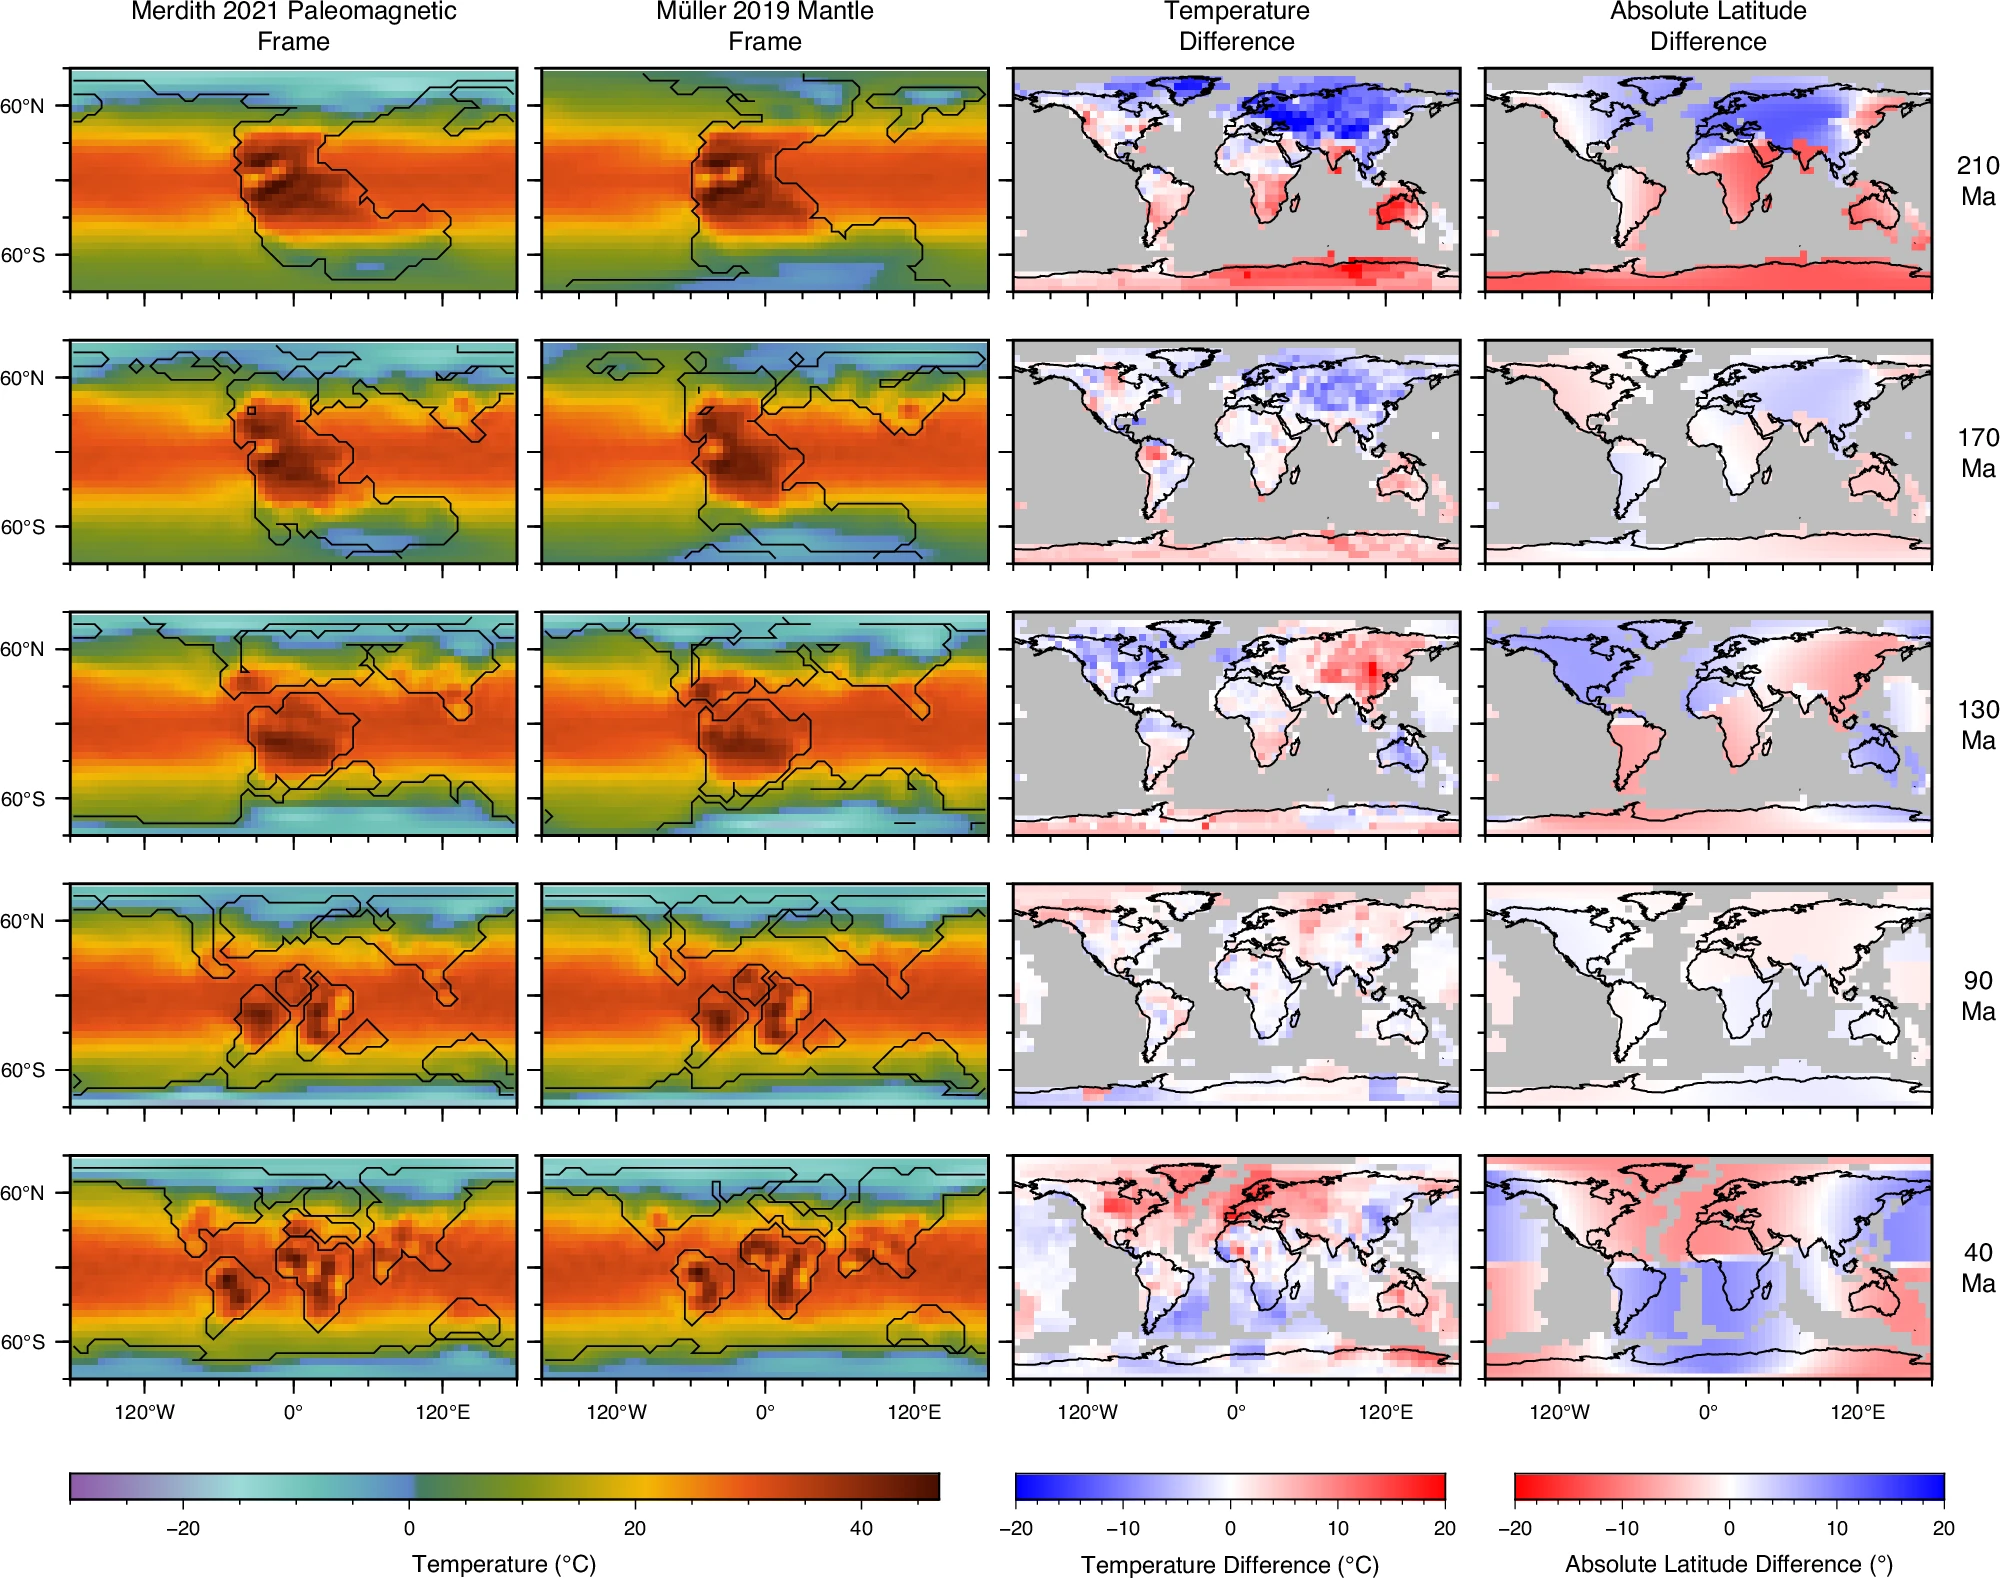
The first column shows the Merdith et al.23 pure paleomagnetic reference frame, and the second column shows the Müller et al.21 hybrid mantle frame. The third column presents the difference in simulated average surface air temperature between the 2 frames, and the fourth column shows the difference in absolute latitude. Both columns are rotated to the present day for easier comparison. Blue areas indicate regions where the pure paleomagnetic frame is cooler in column 3 and closer to the poles in column 4. Conversely red areas indicate regions where the pure paleomagnetic frame is warmer or closer towards the equator. Grey areas represent crust that is unconstrained in the plate reconstruction model.
