
Abstract
Sudden cardiac death from ventricular arrhythmias is a leading cause of mortality worldwide. Arrhythmic death prognostication is challenging in patients with hypertrophic cardiomyopathy (HCM), a setting where current clinical guidelines show low performance and inconsistent accuracy. Here, we present a deep learning approach, MAARS (Multimodal Artificial intelligence for ventricular Arrhythmia Risk Stratification), to forecast lethal arrhythmia events in patients with HCM by analyzing multimodal medical data. MAARS’ transformer-based neural networks learn from electronic health records, echocardiogram and radiology reports, and contrast-enhanced cardiac magnetic resonance images, the latter being a unique feature of this model. MAARS achieves an area under the curve of 0.89 (95% confidence interval (CI) 0.79–0.94) and 0.81 (95% CI 0.69–0.93) in internal and external cohorts and outperforms current clinical guidelines by 0.27–0.35 (internal) and 0.22–0.30 (external). In contrast to clinical guidelines, it demonstrates fairness across demographic subgroups. We interpret MAARS’ predictions on multiple levels to promote artificial intelligence transparency and derive risk factors warranting further investigation.
Main
Sudden cardiac death (SCD) is a leading cause of mortality and a major public health problem worldwide. In North America and Europe, SCD has an annual incidence of 50–100 per 100,000 in the general population1,2,3. Ventricular arrhythmias are the prevalent underlying mechanism in SCD1,4,5. Implantable cardioverter defibrillators (ICDs) can effectively terminate arrhythmic episodes and, when prophylactically deployed, reduce mortality in patients at high risk for SCD due to arrhythmias (SCDA)3. The current paradigm for SCDA risk stratification—a left ventricular ejection fraction (LVEF) of <30–35%—is applicable predominantly in patients with ischemic and dilated cardiomyopathies. Even in these populations, it does not provide a comprehensive risk assessment6, with many ICD recipients not deriving any meaningful health benefits from the therapy7.
SCDA risk stratification is substantially more challenging in patients with hypertrophic cardiomyopathy (HCM), the most prevalent inherited cardiac disease8, as it features heterogeneous clinical presentations and progression9. HCM affects 1 in every 200–500 individuals worldwide and is a primary etiology of SCDA in the young population8,10. The risk stratification criterion of an LVEF of <30–35% is not readily applicable in this population as most patients with HCM who experience lethal arrhythmic events have hyperdynamic left ventricular function. Previous efforts to develop appropriate SCDA risk stratification approaches for HCM have not achieved the desired accuracy or utility11. Studies have focused on either identifying additional risk factors, such as electrocardiogram changes12,13 and genetic variants14,15,16, or interpreting images to extract predictive features from cardiac magnetic resonance (CMR) imaging17,18, all with little impact11. Additionally, personalized mechanistic computational heart models (heart digital twins19) have shown some success in predicting arrhythmias in HCM20; however, the high computational demands limit their utility for patient screening. Finally, although efforts have been made to develop machine learning risk predictors for HCM, they have had numerous limitations, including underuse of imaging data21,22,23,24, lack of well-represented populations21,25 and lack of external validation21,22,23. There is an urgent clinical need for a comprehensive method to forecast the risk of arrhythmic death accurately in patients with HCM, so they can be adequately protected.
Here, we present an innovative artificial intelligence (AI) model named MAARS (Multimodal AI for ventricular Arrhythmia Risk Stratification), designed to predict and interpret SCDA risk in patients by using multimodal medical data. We evaluate the approach in two heterogeneous cohorts of patients with HCM. MAARS uses transformer-based neural networks to analyze multimodal medical data from electronic health records (EHRs), echocardiogram and CMR reports, and contrast-enhanced CMR images. At the core of MAARS are three unimodal branch networks for encoding modality-specific knowledge, as well as a multimodal fusion module to fuse knowledge and distill holistic representations for prognostic SCDA risk stratification. We demonstrate MAARS’ superior performance over all clinical risk assessment tools for HCM, its fairness for diverse demographic subgroups and its generalizability across healthcare systems, in internal cross-validations and an independent external test. MAARS also uses attention- and attribution-based interpretations to improve decision transparency and engender trust. With its demonstrated strikingly high performance and interpretability, MAARS shows the potential of AI-assisted decision-making in improving healthcare delivery in HCM management and SCDA protection.
Results
Study overview
In this study, we used two cohorts of patients with HCM from geographically separate communities to develop and validate our model. A cohort of 553 patients with available contrast-enhanced CMR (that is, late gadolinium enhancement (LGE)-CMR) scans from the Johns Hopkins Hospital (JHH)-HCM registry (Maryland) was used for the development and internal fivefold cross-validation of MAARS. To evaluate MAARS’ generalizability and cross-healthcare-system reliability, we further tested the model on an independent external cohort of 286 patients with HCM who had available LGE-CMR images from the Sanger Heart & Vascular Institute (SHVI)-HCM registry (North Carolina). To establish a baseline level of clinical risk prediction accuracy for this cohort, we applied all widely used clinical tools: the 2020 American College of Cardiology (ACC)/American Heart Association (AHA) guidelines for HCM26, the 2023 European Society of Cardiology (ESC) guidelines for cardiomyopathies27 and the HCM Risk-SCD calculator28. During the internal and external validations, we compared the performance of MAARS to that of all available clinical tools to demonstrate the superior predictive capabilities offered by multimodal AI. We also conducted an ablation analysis of MAARS to illustrate the improvements in prediction brought by the inclusion of multimodal data and the multimodal fusion approach. To analyze the fairness of MAARS, we evaluated model performance in different sex and age subgroups. Finally, we interpreted the predictions made by MAARS and analyzed the knowledge it derived from each data modality.
Patient cohorts
The JHH-HCM registry (internal) included patients who were diagnosed with HCM at the Johns Hopkins HCM Center of Excellence from 2005 to 2015. The patients were followed for a mean duration of 2.86 years, and the primary SCDA endpoint was defined as sustained ventricular tachycardia or ventricular fibrillation, resulting in defibrillator shocks or antitachycardia pacing. Among the 553 patients included in this study, 19 (3%) experienced SCDA during the follow-up.
The SHVI-HCM registry (external) included patients with confirmed HCM, diagnosed according to standard guideline-derived definitions26, who were seen at the Atrium Health SHVI HCM Center of Excellence between 2015 and 2023. The primary endpoint of SCDA was defined as sustained ventricular tachycardia or ventricular fibrillation, resulting in defibrillator shocks or antitachycardia pacing, or out-of-hospital cardiac arrest. Among the 286 patients included in this study, 25 (9%) experienced SCDA during the follow-up.
To provide an overview of the two cohorts and characterize their differences, we present a comparison of clinical covariates between the internal and external cohorts in Table 1. The selected covariates included demographics and risk factors outlined by the ACC/AHA or ESC guidelines, as well as all the other covariates with statistically significant differences between the two cohorts. Of 67 clinical covariates collected in the internal cohort (JHH-HCM) and used in MAARS (Extended Data Tables 1 and 2), 14 are missing from the external (SHVI-HCM) cohort, and 18 presented significant differences between the internal and external cohorts. We used data imputation to fill in the missing information in both cohorts (Methods).
MAARS: a multimodal AI model
Our algorithm, MAARS, seamlessly integrates different input modalities and synergistically fuses the knowledge for SCDA risk stratification through an end-to-end transformer-based design (Fig. 1). MAARS has three unimodal branches: an LGE-CMR branch, an EHR branch and a cardiac imaging report (CIR) branch.

MAARS has three input branches for three types of inputs: LGE-CMR images (left middle, green), clinical covariates from EHRs (left top, blue) and measurements from a CIR, which includes CMR and echocardiogram reports (left bottom, orange). The LGE-CMR images are processed to obtain the left ventricle as a region of interest and then used as input by a 3D-ViT. The EHR and CIR covariates are both structured tabular data and are used as input by dedicated FNNs. The ends of the three input branch networks are connected to a multimodal fusion module, which uses an MBT to fuse knowledge and learn to predict patient-specific SCDA risk scores (see the Methods for detailed explanations). Echo, echocardiogram; ROI, region of interest; METS, metabolic equivalents; SBP, systolic blood pressure.
The LGE-CMR branch network takes LGE-CMR images with raw signal intensities as inputs. The LGE-CMR images are stacks of short-axis slices at multiple locations, providing a full visualization of the geometry of the patients’ left ventricles. The contrast-enhanced regions in the images visualize the disease-induced fibrosis in the myocardium, which mechanistically creates substrates for arrhythmia and leads to SCDA. The use of LGE-CMR images with raw signal intensities is a distinctive feature of our study as it preserves the complete, unprocessed information contained in the scans and eliminates inter-reader variability by avoiding manual image interpretation. A customized three-dimensional vision transformer29 (3D-ViT) is adopted to analyze the LGE-CMR images and encode modality-specific knowledge. This inherent structure for learning on 3D data preserves the complete spatial information and enables the model to correctly learn correlations between LGE-CMR images and propensity for SCDA, offering advantages over conventional models restricted to 2D or 2.5D perspectives.
The covariates in the EHR and CIR branch inputs reflect different aspects of the disease. Feedforward neural networks (FNNs) are adopted in each branch for analyzing EHR and CIR inputs. The EHR input has 40 covariates (Extended Data Table 1) accounting for patients’ demographics, medical history, symptoms and exercise stress test data. The CIR input has 27 covariates (Extended Data Table 2) retrieved from the echocardiogram and CMR reports, which measure cardiac function and morphology using expert-defined markers. Of note, the four covariates from the CMR reports are included although LGE-CMR images are provided to another branch of the network. In this way, we ensure that expert knowledge is embedded in the model through well-established imaging features; the inclusion of these features facilitates explicit analysis of their contributions to SCDA prediction through model interpretation.
After encoding modality-specific knowledge using the unimodal branch networks, MAARS uses a multimodal bottleneck transformer30 (MBT) to fuse knowledge and learn to predict patient-specific SCDA risk scores.
Superior performance of MAARS over clinical guidelines
MAARS’ performance was thoroughly evaluated using the area under the receiver operating characteristic curve (AUROC), balanced accuracy (BA), area under the precision–recall curve (AUPRC), class-balanced Brier score (Bs), sensitivity and specificity (Extended Data Table 3). In the internal fivefold cross-validation, MAARS achieved a mean AUROC of 0.89 (95% confidence interval (CI) 0.79–0.94), a mean BA of 0.80 (95% CI 0.70–0.89), a mean AUPRC of 0.22 (95% CI 0.10–0.34) and a mean Bs of 0.16 (95% CI 0.14–0.20). In the external validation (Extended Data Table 4), despite the dissimilarities of cohort characteristics and some missing covariates, MAARS showed a robust prediction of SCDA events with a mean AUROC of 0.81 (95% CI 0.69–0.93), demonstrating its generalizability to a different healthcare system.
For both cohorts, the risk assessment tools currently used in clinical practice offered limited SCDA prediction accuracy (Fig. 2). In the internal cross-validation, the ACC/AHA guidelines, which list seven major SCD risk factors, with six included in this analysis (missing annotation of left ventricular apical aneurysm), had a mean AUROC of 0.62 (95% CI 0.51–0.73). The ESC guidelines, which list seven major SCD risk factors (all included here), had a mean AUROC of 0.54 (95% CI 0.43–0.65). The HCM Risk-SCD calculator uses seven risk factors (all included here) to calculate a 5-year SCD risk score, resulting in a mean AUROC of 0.54 (95% CI 0.42–0.66). In contrast, MAARS offered risk assessment improvements of 0.27–0.35 in AUROC. When MAARS was chained to the same level of sensitivity as the clinical tools, it offered improvements of 0.33–0.5 in specificity. In the external validation, similarly, the clinical tools were not able to predict SCDA events, with an AUROC of 0.51–0.59. MAARS offered improvements of 0.22–0.30 in AUROC. Additionally, in both internal and external validations, MAARS also had lower Bs than the clinical risk assessment tools (Extended Data Tables 3 and 4), demonstrating that MAARS has better model calibration between the predicted probabilities and the true outcomes. Of note, all clinical risk assessment tools and MAARS had wider CIs of their performance metrics in the external validation than in the internal validation, indicating elevated uncertainty in the performance estimates, potentially due to the smaller external patient cohort.
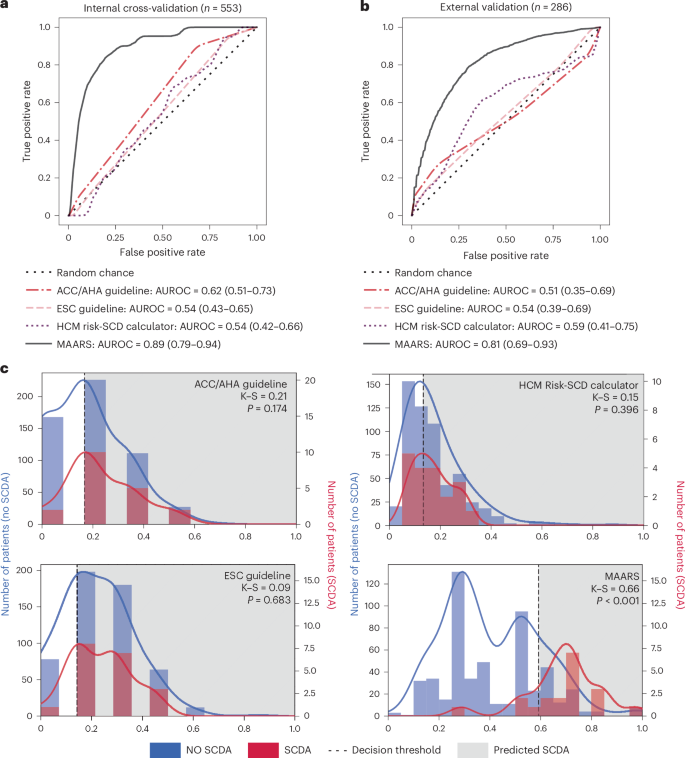
a, Receiver operating characteristic curves and AUROC values (data presented as mean values with 95% CIs) from the internal fivefold cross-validation on the JHH-HCM cohort (n = 553). b, Receiver operating characteristic curves and AUROC values (data presented as mean values with 95% CIs) from the external validation on the SHVI-HCM cohort (n = 286). c, Distributions of predicted SCDA risk scores, with blue bars and curves for patients not experiencing SCDA and red bars and curves for patients experiencing SCDA. Two-sample Kolmogorov–Smirnov tests were conducted to quantify the distance of the distributions for SCDA and no SCDA and to obtain the P values. The dashed vertical line indicates the optimal decision threshold for each predictor, and the shaded gray area on the right of the thresholds indicates patients predicted to have a high risk for SCDA. K–S, Kolmogorov–Smirnov statistic.
Discriminative predictions despite imbalanced datasets
As SCDA events are rare in patients with HCM, the cohorts in this study have highly imbalanced outcomes, posing a great challenge for developing an effective risk assessment tool. We plotted the distributions of predicted risk scores from the clinical risk assessment tools and MAARS to highlight MAARS’ performance on this imbalanced dataset. We analyzed whether there were statistically significant differences in risk score distributions between patients experiencing and those not experiencing SCDA (Fig. 2c). In two-sample Kolmogorov–Smirnov tests, the risk score distributions predicted by the three clinical risk assessment tools were not significantly different (P > 0.05) between patients who did and did not experience SCDA. Despite the imbalanced dataset, MAARS offered discriminative predictions for SCDA risk, with significantly different (P < 0.001) risk score distributions between patients experiencing and those not experiencing SCDA.
Advantages of multimodal fusion
We further investigated the changes in MAARS’ risk assessment performance when individual data modalities were used in the predictor. The performance of the three unimodal branch networks (EHR, CIR and LGE-CMR) is provided in Extended Data Table 3. The EHR data reflect the baseline information about a patient, and the EHR branch network (FNN), serving as the baseline predictor, achieved a mean AUROC of 0.84 (95% CI 0.75–0.89), mean BA of 0.77 (95% CI 0.68–0.85), mean AUPRC of 0.16 (95% CI 0.06–0.26) and mean Bs of 0.18 (95% CI 0.16–0.21) in the internal cross-validation. Comparing, in sequence, the EHR branch network (FNN), MAARS using EHR and CIR, and MAARS using all three modalities (Fig. 3), we found stepwise enhancements in all performance metrics and no difference in their CI ranges, suggesting that integrating multiple aspects of patients’ assessments in MAARS reduces bias without compromising variance.

The box clusters from left to right on the x axis are the performances for a series of data–model combinations: the EHR branch network within MAARS using clinical covariates from EHR (EHR, FNN), the CIR branch network within MAARS using measurements from CIR (CIR, FNN), an FNN taking the concatenation of EHR and CIR as input (EHR + CIR, early fusion, FNN), MAARS operating with only EHR and CIR (EHR + CIR, mid fusion, FNN + MBT), and MAARS operating with full data modalities (EHR + CIR + CMR, MAARS). The three blue boxes (y axes on the left) in each cluster represent the AUROC (dark blue, first box from the left in each cluster), BA (light blue, second box) and AUPRC (medium blue, third box), for which higher values mean better performance. The orange boxes (y axis on the right) represent the Bs, for which lower values indicate better calibration. The box bounds represent the range between the first and third quantiles; the white center line in each box is the mean; the whiskers are the 95% CIs. All values were calculated based on the cross-validation results on the internal cohort (n = 553) using bootstrapping (Methods). The dashed lines represent the baseline metrics by random chance. All values are the calculated AUROC, BA, AUPRC and Bs.
In addition, we analyzed the improvements of the multimodal fusion algorithm within MAARS over an ‘early-fusion’ model (Fig. 3). The early-fusion model is an FNN taking the concatenation of EHR and CIR data in the input directly, a fusion approach widely used in previous studies for predicting adverse cardiac outcomes17,21,22,23,31. Instead, MAARS adopts a ‘mid-fusion’ paradigm (Methods). Results showed that the early-fusion model had lower performance in the cross-validation than MAARS using EHR and CIR, even lower than the performance of the EHR branch network alone, despite more data modalities available to it.
Fairness across different subgroups
To assess the model’s fairness on diverse subgroups, we evaluated MAARS’ performance in different sex and age subgroups of the JHH-HCM cohort in the cross-validation (Fig. 4). MAARS far outperformed the clinical tools in every sex and age subgroup. In the sex subgroup evaluations, MAARS demonstrated AUROC improvements of 0.26–0.36 and BA improvements of 0.15–0.29 over the clinical predictors. In the age subgroup evaluations, MAARS exhibited the highest performance in the middle age subgroup (40–60 years old), with an AUROC of 0.93 and BA of 0.81, but had slightly reduced performance in the young (<40 years old, AUROC = 0.85, BA = 0.79) and old (>60 years old, AUROC = 0.86, BA = 0.72) subgroups. MAARS’ improvements over the clinical tools were even larger among the age subgroups: 0.21–0.46 in AUROC and 0.16–0.36 in BA. Fairness analysis on the external cohort was not conducted due to its limited size.

a–d, The performance metrics (AUROC and BA) are shown for the multimodal AI (MAARS) and the clinical tools (ACC/AHA guidelines, ESC guidelines and HCM Risk-SCD calculator) in different sex (a, b) and age (c, d) subgroups. The bar lengths and the values in the bars are the means; the whiskers are the 95% CIs. All values were calculated based on the cross-validation results on subgroups of the internal cohort using bootstrapping (Methods).
MAARS also exhibited intersubgroup fairness in prediction. MAARS had an AUROC variability of 0.02 and BA variability of 0.05 among sex subgroups and an AUROC variability of 0.08 and BA variability of 0.09 among age subgroups. Conversely, the clinical tools had much higher performance variability. For instance, the HCM Risk-SCD calculator had 0.09 higher AUROC and 0.09 higher BA in female than in male individuals; these were the highest variabilities among all models. The ACC/AHA guidelines could achieve an AUROC of 0.72 and BA of 0.62 in the middle age subgroup, whereas it was not predictive for SCDA events in the young age subgroup (AUROC = 0.51, BA = 0.46), which had the highest incidence of SCDA. The evidence provided here demonstrates that MAARS can predict SCDA with fairness, consistently outperforming all clinical tools in the different demographic subgroups.
Interpretability of MAARS
The interpretability of AI algorithms is paramount for earning trust and widespread adoption in clinical practice. We applied attribution- and attention-based interpretations to MAARS to explain how the EHR and CIR covariates and LGE-CMR images contributed to SCDA predictions. Specifically, the Shapley value32 was used to quantify the attribution of each covariate to SCDA risk assessment in the EHR and CIR branches. A positive Shapley value of a covariate signifies that the covariate contributes to an increase in a patient’s SCDA propensity, and its value quantifies the magnitude of the impact. Using the Shapley value-based explanation on the population level, we identified the most impactful (measured by the mean of absolute Shapley values) covariates that also showed strong correlations with SCDA propensity (measured by Pearson’s correlation coefficient (r) between covariate values and Shapley values) (Fig. 5). From the EHR branch, we found that nonsustained ventricular tachycardia and atrial fibrillation correlated with increased SCDA risk, whereas higher target heart rate (%) measured during a stress test (reflecting chronotropic response to exercise) and African American ethnicity correlated with decreased SCDA risk. From the CIR branch, nonobstructive HCM and higher LGE burden (%) were found to correlate with increased SCDA risk; higher left ventricular end-diastolic volume, systolic anterior motion of the mitral valve, higher LVEF and higher left ventricular outflow tract (LVOT) gradient during stress were found to correlate with decreased SCDA risk. Shapley value-based explanations for individual patients depict the incremental effect of each covariate on the overall risk and thus allow for decision-making (Extended Data Figs. 1 and 2).

a, Plot of Shapley value-based explanations on the internal validation cohort for the clinical covariates from the EHR branch input. The x axis is the mean of absolute Shapley values (quantifying the overall impact of a covariate), and the y axis is the correlation coefficient (Pearson’s r) between covariate values and Shapley values (quantifying a covariate’s correlation with SCDA propensity). Covariates with r > 0.6 or r < −0.6 are considered to have strong correlations with SCDA propensity. Positive correlations are shown in red, whereas negative correlations appear in blue. b, Model-identified EHR covariates with the highest 25% impact (rightmost on the x axis) and strong correlations with SCDA propensity. c,d, Explanations (c) and identified covariates (d) for the CIR branch. e, Attention-based interpretation of the LGE-CMR branch network for patients who experienced (left two columns) or did not experience (right two columns) SCDA. The short-axis LGE-CMR images in the first and third columns are examples of inputs to the LGE-CMR branch, and their corresponding attention maps from the network are overlying the LGE-CMR images and shown in the second and fourth columns. Regions of high attention values (red for patients experiencing SCDA, blue for patients not experiencing SCDA) suggest that the local pixel intensities have high contributions to the network decision process. The yellow arrows point to contrast enhancements in the LGE-CMR images, and the red and blue arrows point to high-attention regions. HR, heart rate; VT, ventricular tachycardia.
Additionally, the covariate interpretation analysis has the potential to enhance model simplification, which is crucial for clinical utility. To further this analysis, we trained and evaluated a simplified covariate network (FNN) taking the most impactful covariates from both EHR and CIR as input (Fig. 5), as well as a simplified MAARS by combining this covariate network with the existing LGE-CMR branch network (3D-ViT) and the multimodal fusion module (MBT). This simplified MAARS model maintained high accuracy in both internal and external validations (Extended Data Table 5), with only a modest decrease in performance compared to the comprehensive MAARS model. This highlights the adaptability of the model to different clinical settings with varying data availability.
The 3D-ViT used for LGE-CMR image analysis had innate attention mechanisms that allowed us to interpret the knowledge gleaned from the images by highlighting areas associated with the network prediction. We quantified attention flows in the trained 3D-ViT using attention rollout (Methods) and visualized the attention to input LGE-CMR images as heatmaps that show image regions important for predicting SCDA risk (Fig. 5e). In LGE-CMR images from patients who experienced SCDA, the regions that MAARS paid high attention to usually included, but were not limited to, enhanced regions. For patients who did not experience SCDA, MAARS areas surrounding LGE appeared important for making predictions. This suggests that MAARS has learned a nuanced relationship between the LGE distributions and the propensity for SCDA.
Discussion
In this study, we developed an AI model, termed MAARS, to predict the risk of SCDA in patients with HCM by using medical data in multiple modalities. MAARS has a transformer-based neural network architecture and includes several modules: (1) a 3D-ViT learning on LGE-CMR images with raw signal intensities that visualize disease-induced myocardial fibrosis distributions; (2) an FNN for analyzing clinical covariates from EHRs; (3) an FNN for analyzing measurements reported on standard echocardiogram reports and CMR radiology reports; and (4) a multimodal fusion module, MBT, to integrate knowledge and stratify SCDA risk from a holistic perspective. We demonstrated the high performance of MAARS through a series of analyses performed in cohorts of patients with HCM, in which our model showed (1) striking improvement in SCDA risk stratification performance over all clinical tools, (2) generalizability to an external patient cohort from a different healthcare system at a geographically separate location, (3) fairness for different patient subgroups (age, sex) and (4) interpretability of the AI predictions. With its validated superior performance over existing clinical tools, generalizability, fairness and interpretability, MAARS has the potential to substantially improve SCDA risk stratification and patient care delivery.
Accurate risk stratification for SCDA in HCM remains a major clinical challenge, and MAARS offers a promising solution. Existing clinical risk assessment tools do not achieve satisfactory accuracy in identifying high-risk patients. Previous clinical validation studies of the ACC/AHA26 and ESC27 guidelines have reported varying C-index values for different cohorts (from 0.52 to 0.92)33,34,35,36,37. In our study, we found the clinical risk assessment tools to have an AUROC (equivalent to the C-index in binary-outcome settings, SCDA versus no SCDA) of 0.51–0.62 for the two cohorts, offering limited value in SCDA risk stratification. With its many methodological innovations, MAARS significantly outperformed all clinical risk assessment tools in the internal and external cohorts. In addition to the strong predictive performance, the generalizability across healthcare systems and the fairness across demographic subgroups also highlight the advantages of MAARS. Supported by MAARS, clinicians can deliver personalized care to their patients and protect them appropriately from SCDA while also reducing unnecessary ICD deployments and the associated drawbacks, namely, infections, device malfunction and inappropriate shocks6.
MAARS embodies an important technological innovation in directly analyzing LGE-CMR images with raw signal intensities for SCDA risk prediction. LGE-CMR images carry rich information regarding cardiac pathology but have long been underused due to complexities in image interpretation. Previous attempts to incorporate LGE-CMR image-derived features24,26,27,38 in SCDA risk predictors had a number of limitations, such as manually engineered features being unable to represent intricate anatomical shapes and scar distributions, as well as image interpretations prone to inter-reader variability. Although there have been efforts to automate the CMR image interpretation process with deep learning17,18, raw medical imaging information remains largely underused. Our previous study pioneered learning on LGE-CMR imaging data with raw signal intensities in ischemic cardiomyopathy39 using a convolutional neural network; a similar network was used in a recent study25. Here, MAARS excelled in analyzing LGE-CMR images with raw signal intensities by adopting an advanced 3D-ViT network, and we validated the advantage of this approach in two large and diverse HCM cohorts.
MAARS demonstrates the value of integrating multimodality information in clinical decision support systems. Although medical assessments of different aspects of cardiovascular health are routinely acquired, the integration of different data modalities for clinical decision-making has remained a challenge40. Previous studies predicting adverse cardiac outcomes simply built models based on a concatenation of all features17,21,22,23,31; this approach, as used by the reference model shown here, underperforms the multimodal fusion structure in MAARS. The dedicated fusion module using an MBT network in MAARS specifically learns the cross-modality interplay and effectively integrates knowledge. The low performance of the reference model might be due to overfitting caused by increased optimization difficulty from the additional data modality41; however, with the multimodal fusion algorithm, MAARS attenuates the overfitting problem and efficiently uses all data modalities.
The multilevel interpretability is a crucial component of MAARS that distinguishes it from the prevailing black-box healthcare AI methods. The individual-level interpretation not only improves the transparency of AI prediction and, therefore, makes MAARS more trustworthy but also paves the way for precision patient care. From the interpretation of risk prediction for a particular patient, a healthcare provider can identify the personalized factors that lead to high SCDA risk in this patient and potentially prioritize modifying these factors to manage the disease trajectory most effectively. In addition, the population-level interpretation can facilitate the discovery of new knowledge. From the AI interpretation, we observed that some findings align with the current consensus and reaffirm their clinical significance, including nonsustained ventricular tachycardia, higher fibrosis burden (LGE %) and lower LVEF being associated with increased SCDA risk26,27. Conversely, some findings may warrant further investigation. For instance, in this study, systolic anterior motion and higher LVOT gradient were associated with lower SCDA risk; meanwhile, nonobstructive HCM was associated with increased SCDA risk. These findings provide information in the debate regarding the prognostic implication of the presence of LVOT obstruction. Although a considerable amount of evidence42 indicates that patients with obstructive HCM are at greater risk of disease-related adverse events, including syncope, heart failure and mortality, recent studies43,44 have provided more granularity on the specific clinical outcomes, suggesting that nonobstructive HCM is associated with a higher burden of ventricular arrhythmia events. This contrasts with atrial arrhythmias, which were more common among patients with LVOT obstruction. The pathophysiologic mechanisms behind the higher SCDA risk in nonobstructive HCM might be the greater severity of myopathy45 associated with a higher burden of ventricular fibrosis46 and the presence of coronary microvascular dysfunction and ischemia47 in these patients. However, it should be noted that these AI-derived interpretations reveal statistical associations and correlations rather than establishing causality and, therefore, cannot be directly interpreted as disease mechanisms. This consideration represents a common challenge faced by the broader AI research community.
This study has several limitations and practical considerations that affect the immediate clinical utility of MAARS. First, MAARS was developed on a single tertiary-care center cohort and, therefore, was potentially exposed to institutional or referral bias. While such biases are common in HCM clinical studies, our research benefits from a relatively large internal patient cohort with diverse demographics, disease severity and comorbidities; it is also strengthened by external validation on a cohort from a geographically separate healthcare system. These advantages are particularly valuable given the requirements for comprehensive clinical data and advanced LGE-CMR imaging. Second, despite being robust in a proof-of-concept study, our cohort sizes remain smaller than those of established risk prediction models being used clinically, such as the HCM Risk-SCD calculator28. The limited cohort sizes combined with the rare incidence of SCDA events resulted in a small absolute number of observed endpoint events (19 in the internal cohort and 25 in the external cohort), especially when compared to the complexity of the MAARS model (67 clinical covariates and LGE-CMR images). This created challenges in model development, increased the risk of model overfitting and added difficulty in precisely estimating performance metrics. This limitation was reflected, for instance, in the wide CI in the external validation results, which is wider than the recommendation of CI width ≤ 0.1 (ref. 48). Nevertheless, the event rate observed in this cohort aligns with that reported in other HCM studies28,49,50, supporting the validity of our study design, and MAARS demonstrated statistically significant superior performance over current clinical tools, highlighting the potential value of integrating multimodal data. A third limitation is the lack of detailed time-to-event information, precluding the assessment of the model’s predictive ability over time. Finally, the increased data requirements of MAARS compared to simpler clinical tools may present a practical barrier to its widespread clinical adoption. Collectively, these limitations underscore the necessity for future research to validate the model’s generalizability in larger cohorts and assess its robustness during longer follow-up periods.
Overall, MAARS is a powerful and trustworthy clinical decision support tool for SCDA risk stratification in HCM developed with state-of-the-art multimodal AI technology. It has validated strong performance, fairness and generalizability and provides interpretations for the predictions. MAARS has the potential to substantially improve clinical decision-making and healthcare delivery for patients with HCM, either directly through future integration with automated data extraction systems or indirectly by serving as a valuable proof of concept for the power of multimodal AI in enhancing personalized patient care.
Methods
This study complies with all relevant ethical regulations and has been approved by the institutional review boards of Johns Hopkins Medicine and Atrium Health.
Patient population and datasets
JHH-HCM registry (internal)
A retrospective analysis was performed on patient data from the JHH-HCM registry spanning 2005–2015. Enrollment in the registry was based on the first visit to the Johns Hopkins HCM Center of Excellence, where patients meeting the diagnostic criteria for HCM were included. These criteria focused on the presence of unexplained left ventricular hypertrophy (maximal wall thickness ≥15 mm) without evidence of uncontrolled hypertension, valvular heart disease and HCM phenocopies, such as amyloidosis and storage disorders. Patients were followed for a mean duration of 2.86 years (median 1.92 years; 25th–75th percentile = 0.94–4.28 years). The current study focused on a subset of patients with HCM who were enrolled between 2005 and 2015 and had adequate LGE-CMR images, totaling 553 patients (Extended Data Fig. 3).
SHVI-HCM registry (external)
A retrospective analysis was performed on patient data from the Atrium Health SHVI-HCM registry spanning 2015–2023. This registry includes patients who presented to the SHVI HCM Center of Excellence with a preexisting HCM diagnosis or were subsequently diagnosed based on cardiac imaging, personal and family history, and/or genetic testing in accordance with current guideline definitions. Patients within this longitudinal database are still being followed, as the endpoint for registry inclusion is the transfer of care to an outside facility or death. For the purposes of this study, the SHVI-HCM registry was interrogated for patients who had undergone CMR imaging and ICD placement, and enrollment was delineated by the patient’s first visit with the SHVI.
Data collection and primary endpoint
Clinical data, including demographics, symptoms, comorbidities, medical history and stress test results, were ascertained during the initial clinic visit and at each follow-up visit. Rest and stress echocardiography and CMR imaging were performed as routine components of clinical evaluation for all patients referred to the HCM centers. For the internal JHH-HCM registry, echocardiography and CMR imaging were conducted before the first clinic visit, with typically 3 months between the imaging assessment and the first clinic visit. For the SHVI-HCM registry, patients typically underwent echocardiography and CMR imaging after the first clinic visit. The full list of covariates used in MAARS can be found in Extended Data Tables 1 and 2. The data were extracted through a manual search of patients’ EHRs. EchoPAC software (GE Healthcare) was used to quantitatively analyze the echocardiogram and compute related covariates. Of note, the internal and external cohorts have distinct patient populations with different demographic characteristics and different levels of risk factors (Table 1).
The CMR images in the JHH-HCM registry were acquired using 1.5-T magnetic resonance imaging (MRI) devices (Aera, Siemens; Avanto, Siemens; Signa, GE; Intera, Phillips). In the SHVI-HCM registry, most CMR images were acquired using 1.5-T MRI devices (Aera, Siemens; Sola, Siemens), and a small proportion of CMR images were acquired using 3-T MRI devices (Vida, Siemens). LGE images were obtained 10–15 min after intravenous administration of 0.2 mmol kg−1 gadopentetate dimeglumine. An inversion scout sequence was used to select the optimal inversion time for nulling normal myocardial signal. All images used were 2D parallel short-axis left ventricular stacks. Typical spatial resolutions were in the range of 1.4–2.9 × 1.4–2.9 × 7–8 mm, with 1.6- to 2-mm gaps.
The primary endpoint for the JHH-HCM registry was SCDA defined as sustained ventricular tachycardia (ventricular rate ≥130 beats per min lasting for ≥30 s) or ventricular fibrillation resulting in defibrillator shocks or antitachycardia pacing. Arrhythmic events were ascertained by reviewing electrocardiogram, Holter monitor and ICD interrogation data. The primary endpoint for the SHVI-HCM registry was SCDA defined as device shock, appropriate interventions or out-of-hospital cardiac arrest.
More details regarding patient inclusion, assessment, follow-up, echocardiography and CMR acquisition can be found in previous work23,51.
Data preparation
The multimodal inputs to MAARS included LGE-CMR scans and clinical covariates from EHRs and CIRs (Extended Data Tables 1 and 2). The labels were the outcomes (SCDA or non-SCDA). The preprocessing steps for LGE-CMR scans (described below) aimed to exclude nonrelevant background information and to standardize the CMR image volume for consistent analysis across all patients. We first obtained the left ventricular region of interest using our previously developed and validated deep learning algorithm52. Once each patient’s LGE-CMR 2D slices were processed using this algorithm, all pixels outside the left ventricle were zeroed out, and the pixels within the left ventricle were normalized by the median blood pool pixel intensity in each slice. Finally, the processed slices were stacked and interpolated to a regular 96 × 96 × 20 grid with voxel dimensions of 4.0 × 4.0 × 6.3 mm.
The EHR and CIR data were structured as tabular data. The input features included in the analysis were ensured to have <40% missing values originally; missing values were imputed using multivariate imputation by chained equations (MICE)53. MICE is a fully conditional specification approach that models each input feature with missing values as a function of all other features iteratively. To address the feature mismatch issue between the internal and external cohorts, we used a MICE imputer based on the internal dataset to impute the missing values in both datasets. After the imputation, the EHR and CIR data were standardized using the z-score method, which involves subtracting the mean and dividing by the s.d. of each feature.
Transformer-based multimodal neural network
Modality-specific branch networks
Three unimodal branch networks are included in MAARS, each learning from a specific input modality: a 3D-ViT29 for LGE-CMR images, an FNN for EHR data and an FNN for CIR data.
In the LGE-CMR branch, the image vector embeddings ζ are obtained by dividing the original 3D image X into n flattened nonoverlapping 3D image patches xi and following the operations
where E is a linear projection, zcls is a classification token (CLS-token) and ‘p’ is a learnable positional embedding to retain positional information.
The image vector embeddings \({\zeta }_{{\rm{CMR}}}^{\,0}\) are then processed by a sequence of LViT transformer encoder blocks. Each transformer encoder block, \({\zeta }_{{\rm{CMR}}}^{\,l+1}={\rm{Transformer}}\left({\zeta }_{{\rm{CMR}}}^{\,l};{\theta }_{{\rm{ViT}}}^{l}\right)\), consists of two submodules: (1) a multihead self-attention (MSA) module and (2) a two-layer fully connected FNN.
where LN is the layer normalization operation. In the final transformer encoder block, the encoded CMR knowledge, ξCMR, is defined as
where W is a learnable matrix.
In the EHR and CIR branches, processed EHR and CIR data are converted to vectors ζEHR, ζCIR fed into two FNNs, with outputs ξEHR and ξCIR representing the encoded EHR and CIR knowledge.
Multimodal fusion
Following knowledge encoding from the LGE-CMR, EHR and CIR subnetworks, we used an MBT consisting of multiple blocks to fuse the knowledge across modalities. MBT has demonstrated state-of-the-art performance in multimodal fusion tasks and has a light computational cost30. In each MBT block, the unimodal knowledge vectors concatenated with a shared fusion vector, ξfsn, are fed into modality-specific transformers:
The fusion vector in layer l + 1 is updated as follows:
The last MBT block outputs a predicted SCDA risk score p using the following equation:
Model training and implementation details
For patient i, their SCDA outcome yi is 1 if they experienced an SCDA event during the follow-up, and 0 otherwise. We adopted the balanced focal loss as the loss function54:
where αi is a class-dependent scaling factor, and γ is the focusing parameter that controls the level of how the model focuses on its mistakes and prioritizes improving on the hard examples, which was set as γ = 2 in this study.
The LGE-CMR, EHR and CIR branch networks were first trained independently, and then MAARS was trained end-to-end with all the branch networks and the multimodal fusion module. All models were trained with a batch size of 64 and a maximum of 150 epochs with early stopping based on loss. The Adam optimizer was used, with β1 = 0.9, β2 = 0.999, and the learning rate was initially set at 1 × 10⁻³ for the LGE-CMR branch network, 1 × 10⁻² for the EHR and CIR branch networks, and 3 × 10⁻² for the multimodal fusion and was adaptively adjusted during the training process. For the LGE-CMR branch network, the ViT has LViT = 8 transformer encoder blocks, eight heads for each attention module and dimension d = 512. The EHR branch network used an FNN with two hidden layers and a latent dimension of 16. The CIR branch network used an FNN with one hidden layer and a latent dimension of 16. The encoded unimodal knowledge vectors have dimensions ξCMR ∈ R32, ξEHR ∈ R16, ξCIR ∈ R16. We set LMBT as 3 and the bottleneck fusion vector dimension as 8.
Assessing model performance and clinical validation
Performance metrics
The values of metrics derived from the confusion matrix (BA, sensitivity and specificity) were computed at optimal probability decision thresholds selected to maximize Youden’s J statistic. When comparing the AI model’s performance to that of the clinical tools, we also adjusted the decision threshold by matching the sensitivities of the clinical tools to evaluate their specificities. All metrics were in the range of 0 to 1, with the baseline levels obtained by random chance being as follows: AUROC = 0.5, BA = 0.5, AUPRC = 0.03 and Bs = 0.25.
Internal and external validation
The internal model performance was assessed in a fivefold cross-validation of the JHH-HCM cohort on the patient level stratified by outcome. The training and test sets were split on the patient level; that is, all LGE-CMR scans corresponding to a given patient case were only present in either the training or validation set and never simultaneously partly in both. After five training folds, the model’s performance metrics were calculated based on the aggregation of all validation folds.
For the external performance evaluation, we trained the model using the entire JHH-HCM dataset (with 90% as the training set and 10% as the development set) and tested the model’s performance on the SHVI-HCM cohort. Of note, the model for external validation inherited the same hyperparameters as the internal model.
Model interpretability
We interpreted the MAARS network weights and predictions using attribution- and attention-based methods.
Shapley value
The EHR and CIR branch networks were interpreted using the Shapley value, which quantifies the incremental attribution of every input feature to the final prediction. The Shapley value32 is based on the cooperative game theory and explains a prediction as a coalitional game played by the feature values. The Shapley value has a collection of desirable properties, including efficiency, symmetry, dummy and additivity. In this study, the Shapley values were estimated using a permutation formulation implemented in SHAP55.
Attention rollout
For the LGE-CMR branch network, we used a technique called attention rollout to quantify attention flows from the start to the end throughout the ViT. Formally, at transformer encoder block l, the average of the attention matrices of all attention heads is Al. The residual connection at each block is modeled by adding the identity matrix I to the attention matrix. Therefore, the attention rollout is recursively computed by
We explained the predictions of the LGE-CMR branch network using the attention rollout at the end of the ViT after flowing through LViT transformer blocks, \({A}_{{\rm{Rollout}}}^{{L}_{{\rm{ViT}}}}\).
Statistical analysis
The P values of clinical covariates between the internal and external cohorts were based on a two-sample Welch’s t-test for numerical variables and the Mann–Whitney U test for categorical variables before data imputation. Kolmogorov–Smirnov tests for the risk score distributions were based on the aggregated predictions on all internal validation folds. The means and CIs of model performance metrics in the internal fivefold cross-validation were estimated using 200 bootstrapping samples of the aggregated predictions on all validation folds. The performance metrics in the external validation were calculated using model predictions on 200 bootstrapping resampled datasets of the SHVI-HCM cohort. The computations were based on the bias-corrected and accelerated bootstrap method. Pearson’s r for clinical covariates in the network interpretations was based on aggregated interpretations from all internal validation folds.
Computational hardware and software
MAARS was built in Python 3.9 using packages including PyTorch 2.0, NumPy 1.23.5, Pandas 1.5.3, SciPy 1.10, scikit-learn 1.2.0, scikit-image 0.19.3, pydicom 2.3, SimpleITK 2.2.1 and SHAP 0.41. Data preprocessing, model training and result analysis were performed on a machine with an AMD Ryzen Threadripper 1920X 12-core CPU and NVIDIA TITAN RTX GPUs, and on the Rockfish cluster at Johns Hopkins University using NVIDIA A100 GPU nodes, with NVIDIA software CUDA 11.7 and cuDNN 8.5. For a reference of the computational requirements of MAARS inference, on a machine with an AMD Ryzen 2700X 8-core CPU and an NVIDIA GeForce RTX 2060 GPU, the average processing time for inference is 0.034 s per patient using GPU or 0.086 s per patient using solely CPU.
Reporting summary
Further information on research design is available in the Nature Portfolio Reporting Summary linked to this article.
Data availability
Patient data and individual-level source data in this article cannot be made publicly available without further consent and ethical approval owing to privacy concerns. The cardiac magnetic resonance imaging data, patient clinical data or source data can be provided by the authors pending approval from the Johns Hopkins University and Atrium Health institutional review boards and a completed material transfer agreement. Requests for these data should be sent to N.A.T. (ntrayanova@jhu.edu). Responses to requests are expected in a month. The final trained model weights are available at https://gitlab.com/natalia-trayanova/maars-public.
Code availability
The code for this project is available at https://gitlab.com/natalia-trayanova/maars-public.
References
Fishman, G. I. et al. Sudden cardiac death prediction and prevention: report from a National Heart, Lung, and Blood Institute and Heart Rhythm Society Workshop. Circulation 122, 2335–2348 (2010).
Adabag, A. S., Luepker, R. V., Roger, V. L. & Gersh, B. J. Sudden cardiac death: epidemiology and risk factors. Nat. Rev. Cardiol. 7, 216–225 (2010).
John, R. M. et al. Ventricular arrhythmias and sudden cardiac death. Lancet 380, 1520–1529 (2012).
Rea, T. D. & Page, R. L. Community approaches to improve resuscitation after out-of-hospital sudden cardiac arrest. Circulation 121, 1134–1140 (2010).
Estes, N. A. M. 3rd Predicting and preventing sudden cardiac death. Circulation 124, 651–656 (2011).
Merchant, F. M., Levy, W. C. & Kramer, D. B. Time to shock the system: moving beyond the current paradigm for primary prevention implantable cardioverter-defibrillator use. J. Am. Heart Assoc. 9, e015139 (2020).
Merchant, F. M., Jones, P., Wehrenberg, S., Lloyd, M. S. & Saxon, L. A. Incidence of defibrillator shocks after elective generator exchange following uneventful first battery life. J. Am. Heart Assoc. 3, e001289 (2014).
Semsarian, C., Ingles, J., Maron, M. S. & Maron, B. J. New perspectives on the prevalence of hypertrophic cardiomyopathy. J. Am. Coll. Cardiol. 65, 1249–1254 (2015).
Maron, B. J. et al. Management of hypertrophic cardiomyopathy: JACC state-of-the-art review. J. Am. Coll. Cardiol. 79, 390–414 (2022).
Maron, B. J. et al. Prevalence of hypertrophic cardiomyopathy in a general population of young adults. Echocardiographic analysis of 4111 subjects in the CARDIA study. Coronary Artery Risk Development in (Young) Adults. Circulation 92, 785–789 (1995).
Ahluwalia, M., Kpodonu, J. & Agu, E. Risk stratification in hypertrophic cardiomyopathy: leveraging artificial intelligence to provide guidance in the future. JACC Adv. 2, 100562 (2023).
Börjesson, E., Svennblad, B., Wisten, A., Börjesson, M. & Stattin, E.-L. Symptoms and ECG changes precede sudden cardiac death in hypertrophic cardiomyopathy—a nationwide study among the young in Sweden. PLoS ONE 17, e0273567 (2022).
Calò, L. et al. The value of the 12-lead electrocardiogram in the prediction of sudden cardiac death. Eur. Heart J. Suppl. 25, C218–C226 (2023).
van Velzen, H. G. et al. Value of genetic testing for the prediction of long-term outcome in patients with hypertrophic cardiomyopathy. Am. J. Cardiol. 118, 881–887 (2016).
Hernesniemi, J. A. et al. Predicting sudden cardiac death using common genetic risk variants for coronary artery disease. Eur. Heart J. 36, 1669–1675 (2015).
Guo, L. et al. Genetic variants associated with unexplained sudden cardiac death in adult white and African American individuals. JAMA Cardiol. 6, 1013–1022 (2021).
Augusto, J. B. et al. Diagnosis and risk stratification in hypertrophic cardiomyopathy using machine learning wall thickness measurement: a comparison with human test–retest performance. Lancet Digit. Health 3, e20–e28 (2021).
Navidi, Z. et al. Interpretable machine learning for automated left ventricular scar quantification in hypertrophic cardiomyopathy patients. PLOS Digit. Health 2, e0000159 (2023).
Laubenbacher, R., Mehrad, B., Shmulevich, I. & Trayanova, N. Digital twins in medicine. Nat. Comput. Sci. 4, 184–191 (2024).
O’Hara, R. P. et al. Personalized computational heart models with T1-mapped fibrotic remodeling predict sudden death risk in patients with hypertrophic cardiomyopathy. eLife 11, e73325 (2022).
Kochav, S. M. et al. Predicting the development of adverse cardiac events in patients with hypertrophic cardiomyopathy using machine learning. Int. J. Cardiol. 327, 117–124 (2021).
Smole, T. et al. A machine learning-based risk stratification model for ventricular tachycardia and heart failure in hypertrophic cardiomyopathy. Comput. Biol. Med. 135, 104648 (2021).
Bhattacharya, M. et al. Identifying ventricular arrhythmias and their predictors by applying machine learning methods to electronic health records in patients with hypertrophic cardiomyopathy (HCM-VAr-Risk Model). Am. J. Cardiol. 123, 1681–1689 (2019).
Zhao, K. et al. Machine learning in hypertrophic cardiomyopathy: nonlinear model from clinical and CMR features predicting cardiovascular events. JACC Cardiovasc. Imaging 17, 880–893 (2024).
Kolk, M. Z. H. et al. Multimodal explainable artificial intelligence identifies patients with non-ischaemic cardiomyopathy at risk of lethal ventricular arrhythmias. Sci. Rep. 14, 14889 (2024).
Ommen, S. R. et al. 2020 AHA/ACC guideline for the diagnosis and treatment of patients with hypertrophic cardiomyopathy: a report of the American College of Cardiology/American Heart Association Joint Committee on Clinical Practice Guidelines. Circulation 142, e558–e631 (2020).
Arbelo, E. et al. 2023 ESC guidelines for the management of cardiomyopathies: developed by the task force on the management of cardiomyopathies of the European Society of Cardiology (ESC). Eur. Heart J. 44, 3503–3626 (2023).
O’Mahony, C. et al. A novel clinical risk prediction model for sudden cardiac death in hypertrophic cardiomyopathy (HCM Risk-SCD). Eur. Heart J. 35, 2010–2020 (2014).
Dosovitskiy, A. et al. An image is worth 16×16 words: transformers for image recognition at scale. In International Conference on Learning Representations 2021 https://openreview.net/pdf?id=YicbFdNTTy (2021).
Nagrani, A. et al. Attention bottlenecks for multimodal fusion. In 35th Conference on Neural Information Processing Systems (NeurIPS 2021) https://proceedings.neurips.cc/paper_files/paper/2021/file/76ba9f564ebbc35b1014ac498fafadd0-Paper.pdf (NeurIPS, 2021).
Corianò, M. et al. Deep learning-based prediction of major arrhythmic events in dilated cardiomyopathy: a proof of concept study. PLoS ONE 19, e0297793 (2024).
Shapley, L. A value for n-person games. Contributions to the Theory of Games II (1953) 307–317. In Classics in Game Theory (ed. Kuhn, H. W.) 69–79 (Princeton Univ. Press, 1997); https://doi.org/10.1515/9781400829156-012
O’Mahony, C. et al. Effectiveness of the 2014 European Society of Cardiology guideline on sudden cardiac death in hypertrophic cardiomyopathy: a systematic review and meta-analysis. Heart https://doi.org/10.1136/heartjnl-2018-313700 (2018).
Dong, Y. et al. Validation of the 2020 AHA/ACC risk stratification for sudden cardiac death in Chinese patients with hypertrophic cardiomyopathy. Front. Cardiovasc. Med. 8, 691653 (2021).
Zegkos, T. et al. Validation of the new American College of Cardiology/American Heart Association Guidelines for the risk stratification of sudden cardiac death in a large Mediterranean cohort with hypertrophic cardiomyopathy. Hellenic J. Cardiol. 63, 15–21 (2022).
O’Mahony, C. et al. International external validation study of the 2014 European Society of Cardiology Guidelines on Sudden Cardiac Death Prevention in Hypertrophic Cardiomyopathy (EVIDENCE-HCM). Circulation 137, 1015–1023 (2018).
Vriesendorp, P. A. et al. Validation of the 2014 European Society of Cardiology guidelines risk prediction model for the primary prevention of sudden cardiac death in hypertrophic cardiomyopathy. Circ. Arrhythm. Electrophysiol. 8, 829–835 (2015).
Wang, J. et al. Radiomics analysis derived from LGE-MRI predict sudden cardiac death in participants with hypertrophic cardiomyopathy. Front. Cardiovasc. Med. 8, 766287 (2021).
Popescu, D. M. et al. Arrhythmic sudden death survival prediction using deep learning analysis of scarring in the heart. Nat. Cardiovasc. Res. 1, 334–343 (2022).
Acosta, J. N., Falcone, G. J., Rajpurkar, P. & Topol, E. J. Multimodal biomedical AI. Nat. Med. 28, 1773–1784 (2022).
Liang, P. P., Zadeh, A. & Morency, L.-P. Foundations and trends in multimodal machine learning: principles, challenges, and open questions. ACM Comput. Surv. https://doi.org/10.1145/3656580 (2024).
Maron, M. S. et al. Effect of left ventricular outflow tract obstruction on clinical outcome in hypertrophic cardiomyopathy. N. Engl. J. Med. 348, 295–303 (2003).
Lu, D. et al. Clinical outcomes in patients with nonobstructive, labile, and obstructive hypertrophic cardiomyopathy. J. Am. Heart Assoc. 7, e006657 (2018).
Parcharidou, D. et al. The natural history of hypertrophic cardiomyopathy in a large Mediterranean cohort. J. Cardiovasc. Med. (Hagerstown) 21, 428–434 (2020).
Pozios, I. et al. Rest and stress longitudinal systolic left ventricular mechanics in hypertrophic cardiomyopathy: implications for prognostication. J. Am. Soc. Echocardiogr. 31, 578–586 (2018).
Maron, M. S. et al. Contemporary natural history and management of nonobstructive hypertrophic cardiomyopathy. J. Am. Coll. Cardiol. 67, 1399–1409 (2016).
Pozios, I. et al. Comparison of outcomes in patients with nonobstructive, labile-obstructive, and chronically obstructive hypertrophic cardiomyopathy. Am. J. Cardiol. 116, 938–944 (2015).
Riley, R. D. et al. Evaluation of clinical prediction models (part 3): calculating the sample size required for an external validation study. BMJ 384, e074821 (2024).
Schinkel, A. F. L. et al. Outcome and complications after implantable cardioverter defibrillator therapy in hypertrophic cardiomyopathy: systematic review and meta-analysis. Circ. Heart Fail. 5, 552–559 (2012).
Fahmy, A. S. et al. Radiomics of late gadolinium enhancement reveals prognostic value of myocardial scar heterogeneity in hypertrophic cardiomyopathy. JACC Cardiovasc. Imaging 17, 16–27 (2024).
Bhattacharya, M. et al. Machine learning methods for identifying atrial fibrillation cases and their predictors in patients with hypertrophic cardiomyopathy: the HCM-AF-Risk Model. CJC Open 3, 801–813 (2021).
Popescu, D. M. et al. Anatomically informed deep learning on contrast-enhanced cardiac magnetic resonance imaging for scar segmentation and clinical feature extraction. Cardiovasc. Digit. Health J. https://doi.org/10.1016/j.cvdhj.2021.11.007 (2021).
van Buuren, S. & Groothuis-Oudshoorn, K. MICE: multivariate imputation by chained equations in R. J. Stat. Softw. 45, 1–67 (2011).
Lin, T.-Y., Goyal, P., Girshick, R., He, K. & Dollár, P. Focal loss for dense object detection. IEEE Trans. Pattern Anal. Mach. Intell. https://doi.org/10.1109/TPAMI.2018.2858826 (2020).
Lundberg, S. M. & Lee, S.-I. A unified approach to interpreting model predictions. In 31st Conference on Neural Information Processing Systems (NIPS 2017) https://proceedings.neurips.cc/paper_files/paper/2017/file/8a20a8621978632d76c43dfd28b67767-Paper.pdf (2017).
Acknowledgements
This work is supported by National Institutes of Health grants R01HL166759 (N.A.T.), R01HL174440 (N.A.T.) and R35HL1431598 (A.G.H.) and a Leducq Foundation grant (N.A.T.).
Author information
Authors and Affiliations
Contributions
C.L., M.Y., A.G.H., D. M. Phelan, M.R.A. and N.A.T. contributed to the study design. E.G.K., S.L.Z., J.C., D. M. Phelan, A.G.H. and M.R.A. provided clinical perspectives and interpretations. E.G.K., D.-Y.L., E.S. and E.B. assisted with data curation. C.L. M.Y. and N.A.T. developed the methodology. D. M. Popescu assisted with the machine learning methodology. C.L. was responsible for the investigation, data processing, software development, result analysis and manuscript writing. M.Y. and N.A.T. contributed to the writing of the paper. N.A.T. was the senior supervisor on all aspects of the project. All authors read, edited and approved the final manuscript.
Corresponding author
Ethics declarations
Competing interests
The authors declare no competing interests.
Peer review
Peer review information
Nature Cardiovascular Research thanks Declan O’Regan and Jagmeet P. Singh for their contribution to the peer review of this work.
Additional information
Publisher’s note Springer Nature remains neutral with regard to jurisdictional claims in published maps and institutional affiliations.
Extended data
Extended Data Fig. 1 Personalized interpretation of EHR branch network predictions.
Shown are Shapley value-based interpretations for a patient who did not experience SCDA (top panel) and a patient who experienced SCDA (bottom panel). The plots are read from bottom up: the number under the x-axis is the mean risk score for the cohort (0.389); the blue and red bars are the Shapley values associated with the input covariates, representing the effect of each covariate on the output risk score; finally, with the effects from all the covariates, the model reaches its final prediction on top of the plot (value of f(x)).
Extended Data Fig. 2 Personalized interpretation of CIR branch network.
Shown are Shapley value-based interpretations for a patient who did not experience SCDA (top panel) and a patient who experienced SCDA (bottom panel). The plots are read from bottom up: the number under the x-axis is the mean risk score for the cohort (0.545); the blue and red bars are the Shapley values associated with the input covariates, representing the effect of each covariate on the output risk score; finally, with the effects from all the covariates, the model reaches its final prediction on top of the plot (value of f(x)).
Extended Data Fig. 3 Study flowcharts.
The flowchart (a) shows the eligibility assessment of patients from the JHH-HCM cohort, a subset of which was used for cross-validation. The flowchart (b) shows the eligibility assessment of patients from the SHVI-HCM cohort for external validation.
Supplementary information
Rights and permissions
Open Access This article is licensed under a Creative Commons Attribution-NonCommercial-NoDerivatives 4.0 International License, which permits any non-commercial use, sharing, distribution and reproduction in any medium or format, as long as you give appropriate credit to the original author(s) and the source, provide a link to the Creative Commons licence, and indicate if you modified the licensed material. You do not have permission under this licence to share adapted material derived from this article or parts of it. The images or other third party material in this article are included in the article’s Creative Commons licence, unless indicated otherwise in a credit line to the material. If material is not included in the article’s Creative Commons licence and your intended use is not permitted by statutory regulation or exceeds the permitted use, you will need to obtain permission directly from the copyright holder. To view a copy of this licence, visit http://creativecommons.org/licenses/by-nc-nd/4.0/.
About this article

Cite this article
Lai, C., Yin, M., Kholmovski, E.G. et al. Multimodal AI to forecast arrhythmic death in hypertrophic cardiomyopathy. Nat Cardiovasc Res 4, 891–903 (2025). https://doi.org/10.1038/s44161-025-00679-1
Received:
Accepted:
Published:
Version of record:
Issue date:
DOI: https://doi.org/10.1038/s44161-025-00679-1
This article is cited by
-
AI approaches for predicting progression to acute coronary syndrome among stable coronary heart disease patients
npj Cardiovascular Health (2025)
-
Unveiling the Future of Infective Endocarditis Diagnosis: The Transformative Role of Metagenomic Next-Generation Sequencing in Culture-Negative Cases
Journal of Epidemiology and Global Health (2025)
