
Abstract
August 2023 was the driest Indian monsoon August in recorded history, the causes for this extended precipitation deficit in an otherwise typical monsoon remaining unclear. Given that monsoonal precipitation is highly sensitive to northern hemispheric aerosol abundances, here we investigate whether the smoke emitted by the unprecedented Canadian wildfires that occurred during the same season contributed to the monsoon anomaly. We conducted ensemble simulations with a state-of-the-art Earth System Model and a very similar precipitation anomaly during the Indian monsoon is observed when accounting for the Canadian fire smoke, as opposed to when not accounting for it. The mechanism proposed for this anomaly based on model findings is the generation of a pronounced low-level pressure anomaly over the Asian continent following smoke-related cooling, which led to weakened monsoonal winds and reduced moisture transport in the region, thus diminishing Indian monsoon precipitation. The modelled mechanism is supported by comparisons with radiosonde, reanalysis and satellite data that we performed. Wildfires are becoming more severe with climate change, and our study highlights the potential for large-scale wildfire events to impact crucial meteorological phenomena in regions very far away from the emission source.
Introduction
Wildfires have become a subject of intense interdisciplinary research due to their significant impacts on both humanity and the environment1,2,3,4. As a result, the development of strategies and models aimed at analysing large fire events and assessing their consequences remains a critical priority. A recent and notable example is the unprecedented 2023 Canadian wildfires, which resulted in the loss of approximately 5% of Canada’s total forest area between May and September 2023 (2023 Canada Report. Canadian Interagency Forest Fire Centre. https://ciffc.ca/sites/default/files/2024-03/03.07.24_CIFFC_2023CanadaReport%20%281%29.pdf) (The State of Canada’s Forests: Annual Report 2022. Canadian Minister of Natural Resources. https://natural-resources.canada.ca/forest-forestry/much-forest-does-canada-have). This figure is seven times greater than the average annual area burned in Canada over the past four decades5. These wildfires also resulted in the highest wildfire emissions ever recorded in Canada (Copernicus: Emissions from Canadian wildfires the highest on record – smoke plume reaches Europe. Atmosphere Monitoring Service, Copernicus. https://atmosphere.copernicus.eu/copernicus-emissions-canadian-wildfires-highest-record-smoke-plume-reaches-europe), with emissions quantitatively comparable to the annual fossil fuel emissions of major nations6. The emitted pollutants included substantial quantities of aerosols, along with reactive and non-reactive gases, posing serious threats to air quality and climate stability6,7.
The ongoing rise in global mean temperatures, coupled with decreasing regional humidity, both driven by climate change, have been identified as primary factors contributing to the unprecedented wildfire activity observed in recent years in Canada8. Such conditions have led to a substantial increase in fire risk, with 2023 recorded as the warmest and driest year since at least 19809. Understanding the atmospheric consequences of such large-scale wildfire events is crucial, as projections indicate a marked escalation in fire activity across multiple regions worldwide in the coming decades10,11,12, and, generally, climate models suggest that the extreme conditions observed in 2023 are likely to become a baseline by the 2050 s13. Advancing our knowledge of these impacts requires the application of various modelling techniques with differing levels of complexity14,15,16. The fact that high-latitude regions are warming at an accelerated rate compared to the global average17,18, and exhibit pronounced interannual variability in wildfire emissions19,20, further underscores the urgency of assessing the atmospheric effects of wildfires in these regions.
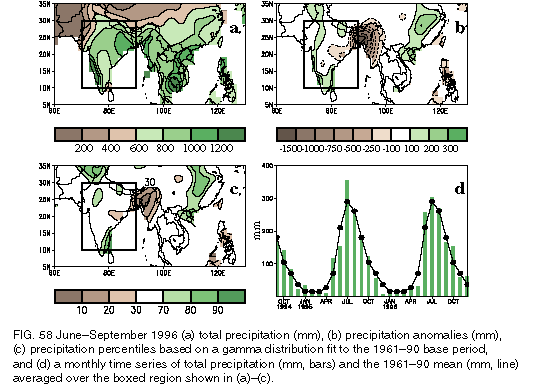
A record-breaking 36% deficit of the climatological total national rainfall over India was seen in August 2023 (“Explained: What Factors Led to India Witnessing Its Hottest and Driest August in 122 Years?” Ashmita Gupta, The Times of India, (archived) https://web.archive.org/web/20230908235312/https://weather.com/en-IN/india/news/news/2023-09-08-why-did-india-witness-its-hottest-and-driest-august-in-122-years). The event points to August 2023 being the driest August for India since the beginning of India’s meteorological record-keeping in 1901 (“Explained: What Factors Led to India Witnessing Its Hottest and Driest August in 122 Years?” Ashmita Gupta, The Times of India, (archived) https://web.archive.org/web/20230908235312/https://weather.com/en-IN/india/news/news/2023-09-08-why-did-india-witness-its-hottest-and-driest-august-in-122-years). This is especially notable since August is typically the 2nd wettest month of the Indian monsoon (National Oceanic and Atmospheric Administration (NOAA), https://www.cpc.ncep.noaa.gov/products/assessments/assess_96/fig58.gif). Our goal is to determine whether another record-breaking event, the 2023 Canadian wildfire emissions, could have had a role in driving the rainfall anomalies. In general, remote forcings, whether land-based or aerosol-driven, can exert strong controls on the Indian monsoon system. It has been found that regional aerosol perturbations can lead to fast negative precipitation responses over Asia due to a weakening of monsoon circulations over Asia related to the decreased land–ocean temperature contrast resulting from land cooling21. A study employing the ICTP-RegCM4 model has demonstrated that extended desertification of the Thar desert can substantially alter Indian hydroclimate through modifications in land–atmosphere coupling and circulation patterns22. Similar research on tropical deforestation has shown that remote land-use changes can significantly influence Indian monsoon rainfall by altering large-scale moisture transport and atmospheric stability23.
Other studies have shown that anthropogenic aerosols in the mid-latitudes are able to drive rainfall anomalies of the scale of those experienced in August 2023 in the Indian monsoon region24,25,26,27, but the role of fire aerosols has not been examined. In terms of differences between wildfire emissions and other types of emissions, biomass burning releases large amounts of carbon dioxide and carbon monoxide but is also a dominant global source of PM₂.₅, black carbon, organic carbon, and various reactive trace gases28,29. Compared to most anthropogenic emissions, wildfire plumes exhibit higher emission factors for CO, organic carbon, and reduced nitrogen species, reflecting incomplete combustion and smouldering phases, while fossil-fuel sources tend to be richer in SO₂, NOₓ, and trace metals due to high-temperature, controlled combustion30. In contrast to biogenic emissions, which are largely continuous and dominated by specific VOC classes such as isoprene and monoterpenes, wildfire emissions are highly episodic, chemically complex, and rapidly evolving through plume aging and secondary aerosol formation. In a recent study31, we utilised the EC-Earth3 Earth system model32 to examine the large-scale atmospheric impacts of the 2023 Canadian wildfire emissions, focusing on both atmospheric composition changes and meteorological effects across the NH mid-latitudes. In this work, we study the linkages between the Canadian wildfire smoke of 2023 and precipitation anomalies identified over India, investigating whether extreme wildfires in Canada could bring about large-magnitude monsoon anomalies of the same size as in August 2023.
Results
Modelled anomaly and comparison with observations
A report of the precipitation anomaly compiled by the Indian Meteorological Department33 details the monsoon deficiency event and credits it to a change in the MJO (Madden-Julian Oscillation) phase towards phases 8 and 1, which caused a large monsoon precipitation deficiency. The report shows both the MJO phase diagram for the given monsoon season, and the precipitation anomalies for August and September, stating that the precipitation anomalies are due to the MJO being in an unfavourable phase. Generally, the MJO can be characterised by eight phases which correspond to either enhanced or suppressed convection, either enhancing or supressing monsoon rainfall over India, and phases 1, 2, 7, and 8 are typically considered “dry phases”34. It has been previously demonstrated that the juxtaposition of strong MJO activity with a developing El Niño, both of which interfere constructively with each other to produce major perturbations to the distribution of tropical heating, can lead to severe Indian monsoonal droughts35. However, analysis of historical MJO index data indicates that these MJO phase drifts were not extremely acute and, although MJO indices of that period are not indicative of a weak MJO, the phase drifts are far from being historically significant36. A recent study attributes the August 2023 precipitation deficit to a complex interplay of the 2023 El Niño and IOD anomalies which drove upper-level convergence and low-level divergence37. The observed precipitation anomaly is not atypical, as the strong minus weak monsoon years anomaly shows a spatially similar anomaly, due to the presence of the Western Ghats mountains that feature larger precipitation totals and therefore stronger response signals in absolute terms38. While it is feasible that this mechanism did indeed occur, as it will be seen in the following results, our experiments have produced a very similar anomaly by comparing the results from model runs with 2023 Canadian wildfire emissions (FIRE) and without 2023 Canadian wildfire emissions (noFIRE).
For a direct comparison of the observed precipitation anomaly and the model anomaly in EC-Earth3 due to the 2023 Canadian wildfire emissions (see Methods), ERA5 reanalysis precipitation data (ECMWF, Climate Data Store, https://cds.climate.copernicus.eu/datasets/reanalysis-era5-single-levels-monthly-means?tab=download&itid=lk_inline_enhanced-template) is contrasted with model precipitation data for the month with lowest total precipitation anomaly over India (August in ERA5, July in EC-Earth3), while model total cloud cover and model surface air temperature anomalies are also shown (Fig. 1).

ERA5 precipitation anomaly (2023 - climatology) (a), model precipitation (b), total cloud cover (c), surface air temperature anomaly (FIRE - noFIRE) (d) for the event month (month with the largest monsoon precipitation reduction), i.e., August in the observations and July in the model over India and the Arabian Sea. The delta (Δ) symbol represents the difference between the simulation scenarios with and without 2023 Canadian wildfire emissions.
Regarding the modelled precipitation anomalies due to the Canadian wildfires, as seen in Fig. 1, there is a very good match in the location, shape and magnitude of the modelled and measured precipitation anomalies during the month of the driest anomaly, with both measured and modelled anomalies exceeding −5 mm/day in much of India, and reaching isolated values as high as −16.79 mm/day and −20.65 mm/day in the observations and model, respectively. The modelled total cloud cover anomaly of the driest month is similarly found to be negative in the model, with changes of 5–20% over most of west India. In support of the ERA5 precipitation anomaly, satellite remote sensing was also be used to confirm the shape and size of the precipitation anomalies in the month of interest, this analysis being relegated to the supplement (Figure 5-S).
Modelled surface air temperature anomalies exhibit cooling over the northern Arabian Sea, land areas to the west of India, and in fact throughout much of Eurasia, as also demonstrated in the results of our previous study31. A plot of the modelled surface atmospheric temperature anomaly in the Eurasian area is illustrated in the supplement (Figure 1-S). In contrast, over the Indian peninsula there are increases in temperatures. This modelled positive anomaly mainly arises because of the decrease of cloud cover leading to more incident radiation. Furthermore, because of the negative modelled precipitation anomaly (Fig. 1-b), moisture recycling over India is suppressed and there is less modelled evapotranspiration. Temperature measurements support this result, as during the event month India registered the highest average maximum surface temperature (32.19 °C) and the highest mean surface temperature (28.45 °C) ever recorded in India, whilst the difference in mean surface temperature between August 2023 and normal (1981–2010 average August) is 0.9 °C (India Meteorological Department, Ministry of Earth Sciences, Government of India, Monthly Climate Summary for August 2023 https://imdpune.gov.in/mcs.php).
Model data shows that the principal mechanism which led to the precipitation anomaly was a slowing down of westerlies over the central Arabian Sea generated by high pressure (Fig. 2). This modelled high surface pressure anomaly is centred on the northern Arabian Sea, originating from modelled surface cooling occurring over the Asian continent and particularly over the northern Arabian Sea as a result of the emissions impact31, driving an easterly wind anomaly over the central Arabian Sea, opposing the typical westerly winds of the summer Indian monsoon period which bring moist air that then condenses over the coastline to form precipitation (Fig. 2). In our previous study31, it is further detailed how this modelled surface cooling takes place due to a dual AOD (aerosol optical depth) and cloud cover increase reducing net downward radiative flux, which then is linked to a decrease in surface atmospheric temperature. Thus, the modelled pressure gradient between the northern Arabian Sea area and the central Arabian Sea and southern Indian landmass leads to a weaker inflow of moisture from the western Indian Ocean and the Arabian Sea39.

ERA5 surface pressure and winds at 850hPa anomaly (2023 - climatology) and model surface pressure and winds at 850hPa anomaly (FIRE - noFIRE) for the event month (month with the largest monsoon precipitation reduction) over India and the Arabian Sea.
Once again, we use ERA5 reanalysis data, in this case surface pressure and wind at 850hPa, to compare between the real-world 2023 anomaly from climatology, and the response due to Canadian fire emissions in EC-Earth3, by illustrating the wind conditions of the reanalysis event month (August) and the model event month (July). The ERA5 reanalysis 850hPa wind anomalies confirm the occurrence of anomalous easterlies during the dry month, and they also confirm the increase of surface pressure in the northern Arabian Sea (Fig. 2). The pressure changes are more intense in the observations than in the model, however the weakening of relevant westerlies is clear and of similar magnitude in both cases. Thus, it is seen that reanalysis data supports the hypothesis derived from model data relating a high surface pressure anomaly, ultimately generated by the 2023 Canadian wildfire emissions, to the Indian precipitation anomaly. Notable is also the fact that the upper-level wind anomaly shows what might be a slowing down of the tropical easterly jet, which can be linked to subseasonal Indian droughts40 – discussion and analysis of these anomalies can be found in the supplement (Figure 4-S). Similar anticyclonic circulation patterns are well known during break phases of the Indian summer monsoon and have been widely documented in previous studies. For example, weakened low-level westerlies and dominant synoptic disturbances have been demonstrated to be characteristic features during monsoon breaks23. More recently, it has been showed using a complex network framework that such circulation and moisture transport anomalies are intrinsic to monsoonal intraseasonal variability41.
An examination of Fig. 2 shows why ERA5 data exhibits increases in precipitation in the near-equatorial Indian Ocean in Fig. 1, which are largely absent in model data. Since they are based on real-world observation, the ERA5 plots inherently represent a fully coupled tropical anomaly, comprised of various internal climate variability modes and large-scale ocean–atmosphere processes, whereas our model simulations isolate the fast response to the wildfire emissions. The increased equatorial precipitation in ERA5 is accompanied by strengthened winds, indicating greater moisture transport and convergence near the Equator. Such circulation changes are consistent with large-scale tropical variability. Consequently, the fact that the model data does not show the equatorial precipitation signal that ERA5 shows should not be interpreted as a model deficiency. The modelled FIRE – noFIRE anomaly is strictly resultant from the addition of the wildfire emissions by experimental design, while the averaging of multiple ensemble members reduces the changes of random behaviour within a certain simulated monsoon period to exert major influence on our signals.
To further verify the validity of our main hypothesis regarding the slowing down of westerlies, other sources of data can be examined. First, radiosonde wind data at 850hPa is used, extracted from the platform hosted by the Department of Atmospheric Science of the University of Wyoming42. Two locations situated in the area of the greatest precipitation decrease, Bombay and Kochi, are selected, and wind speed data is shown for July and August 2023 (Fig. 3).

Wind speed at 850 hPa for 2023 July and August in Bombay and Kochi determined through soundings (diurnal 12Z and nocturnal 00Z).
As part of the proposed mechanism, the main factor is a weakening of westerlies, and at both Bombay and Kochi a general decrease in wind speed at 850hPa can be seen (Fig. 3). July and August westerlies over India during typical monsoons remain constant43,44,45, therefore such behaviour can be considered anomalous and once again in support of the main hypothesis of this work. To compound these results and to gather more potential correlations between model data and instrumental data, the JMA Himawari 8 and 9 dataset can be called upon to provide satellite information of the Indian region in those time intervals46,47. Of interest to this analysis is the fact that such data can be used to examine cloud cover, since model data shows a reduction in cloud cover over India in the dry month anomaly, and Himawari data has also been recently used in wildfire studies48. The conclusion of this data examination is that India exhibits less total cloud cover in August, even less than the month of June when the monsoon had just begun, therefore the measured cloud cover decrease in the measured drying event month matches with the model finding a reduced cloud cover in the model experiment drying event month (Figure 6-S).
To better understand how the pressure gradient mechanism affects modelled precipitation occurrence and moisture transport, the total column moisture flux and divergence can be used to illustrate transport anomalies (Fig. 4).

Model total column moisture flux and divergence anomaly (FIRE - noFIRE) for the driest month, i.e., July in the model over India and the Arabian Sea.
As expected, the modelled total column moisture flux highlights anomalous transport of moisture away from India due to the wildfire aerosol emissions (Fig. 4). Intense divergence anomaly values can be found in the event month over the region of highest precipitation anomaly in India, and throughout the northern Arabian Sea signifying a slowing down of the main supply of moisture of the summer Indian monsoon (Fig. 4). The results indicate that the weakened westerlies produce a reduction of westerly moisture transport into the Indian region and Arabian Sea region. This lends further support to the hypothesis that the pressure gradient mechanism was responsible for the reduced precipitation. The order of magnitude of the modelled total column moisture flux anomalies falls under expected values for the given scenario, that is an aerosol-driven modification of the Indian monsoon, with similar values being found in a recent study which considered the effects of dust AOD increases directly over the Arabian Sea49. Furthermore, moisture fluxes described by a strong minus weak Indian monsoon anomaly (easterly near-equatorial, westerly Central and Southern India, easterly Northern India)38 would manifest in a completely opposite pattern to what is seen in Fig. 4, indicating that the modelled anomaly correctly describes monsoon weakening.
We find a 1-month mismatch between the month of the maximum precipitation anomaly in our EC-Earth experiments (July), and the month of the maximum real-world precipitation anomaly in 2023 from ERA5 (August). The reason for this difference could be found in discrepances between model data and background meteorology. The purpose of our model experiments is to investigate the impacts of emissions as large as those of the 2023 Canadian wildfires not specifically for 2023 but for an example year, which in this case is nominally 2015. If these differences between the background conditions of 2023 vs model data were the cause of mismatch in the timing of the effects, then one would expect sizeable differences between the modelled and the 2023 conditions regarding zonal wind across the NH in the first months of the wildfire event, especially over Eastern Canada, the Northern Atlantic, and Europe. Specifically, if it were found that the modelled May-June NH zonal wind was more intense eastward than the measured 2023 May-June NH zonal wind over the previously mentioned areas of interest, then this means that in our model data the anomalies were more effectively advected downwind.
To investigate this matter, ERA5 850 hPa zonal wind data is compared with FIRE 850hPa zonal wind over the months of May and June, and the results are shown in Fig. 5.

Zonal wind difference at 850 hPa in the FIRE simulation and ERA5, for May and June 2023.
Figure 5 illustrates that the May and June zonal wind over Canada, the northern Atlantic, Europe and even parts of central Asia and western Russia is more intense westward in FIRE than the ERA5 zonal wind, pointing to the fact that the model manifested an eastward bias as expected. Further measurement data also suggests major intrusions of aerosols from the Canadian event only just arriving in late June in Spain and Portugal50 (“2023: A year of intense global wildfire activity”, Copernicus, Atmospheric Monitoring Service, https://atmosphere.copernicus.eu/2023-year-intense-global-wildfire-activity), whereas in our modelled results major intrusions cross the Atlantic earlier. A plot of the modelled global aerosol AOD anomaly for May and June is shown in the supplement (Figure 3-S) in support of this statement. Based on the above, model data presents a positive zonal wind bias for May and June. What also cannot be excluded as a contribution to this bias is the fact that EC-Earth3 generally manifests a slight positive zonal wind bias around 850hPa in the 45° – 60° latitude area32, which matches with what we find. More information on the measured and modelled hemispheric transport of the 2023 Canadian wildfire aerosols can be found in the supplement.
Secondary mechanisms
Following the explanation of the pressure gradient mechanism, it is possible to investigate how and if an MJO shift could have been caused by the biomass burning emissions and if this might act as a secondary mechanism, given the fact that the commonly accepted explanation for the August 2023 precipitation anomaly is a change in the calculated MJO phase33. The velocity of the eastward propagation of precipitation anomalies which are characteristic of the MJO is mostly governed by the ratio between low-level Rossby westerlies and Kelvin easterlies51,52. The stronger the Rossby westerly component (850 hPa double cyclone typical of the wind structure of the MJO), the slower the eastward propagation53. The previously established modelled pressure gradient driven by the wildfire aerosols could play into this, since the slowing down of westerlies over the central Arabian Sea could imply a strengthening of the northern part of the double cyclone structure describing the Rossby component, thus slowing down the MJO and allowing the MJO index phase shift to be a secondary mechanism driving the drying. It should be noted that the EC-Earth3 model can simulate MJO conditions, even if it cannot fully capture its moisture mode behaviour54,55. However, there is no further reason to assume that modelled MJO behaviour will be in phase with observed 2023 MJO behaviour without nudging or initialization to observed 2023 conditions56. In fact, it is possible that desynchronization between modelled and real-world MJO/BSISO phase could have contributed to the previously mentioned 1-month mismatch between the modelled maximum precipitation anomaly and the maximum real-world precipitation anomaly. A full discussion of the modelled MJO shift analysis is contained in the supplement (Figure 7-S).
Another factor to be considered related to the MJO is a counterpart phenomenon known as the boreal summer intraseasonal oscillation (BSISO), which is a key component of tropical climate variability, characterized by eastward and north-eastward propagation of organized convection across the Indo-Pacific region57. Exhibiting a more complex meridional behaviour, it can be associated with active or break periods in Indian monsoons - active monsoon periods commonly occur when either BSISO or MJO are in active phases, and long break periods occur when both are weak or in unfavourable phases. This correlation means that, if the MJO is pushed into a phase unfavourable to the Indian monsoon, its convective envelope relocates away from the Indian sector, which can reduce the large-scale moisture and circulation anomalies that help sustain BSISO growth58. However, August 2023 showed weakened BSISO conditions, matching with anomalously decreased precipitation and the measured MJO behaviour (CLIVAR-GEWEX Monsoons Panel and WG Asian Australian Monsoons, R. S. Ajayamohan, https://wmo-iwm8.tropmet.res.in/public/IWM8_Presentation/IWM8-P/Day-1/Session-1/4-Theme1_OT2_AM2022_2023_Thea%20Turkington.pdf). In terms of other possible secondary mechanisms, a shift in the ITCZ (Inter-Tropical Convergence Zone) can be considered. While long-term effects via ITCZ shifts caused by remote aerosols are documented25, the fast response from emissions is unlikely59,60 and can only take place in case of an unrealistic increase, such as a sudden five-fold increase of all anthropogenic emissions in the Northern Hemisphere60. The cooling effect of wildfire emissions could theoretically shift the ITCZ southward, reducing precipitation, but measured data does not support this, as flooding in Bangladesh alongside India’s drying anomaly as well as the lack of a consistent latitudinal and temporal pattern, contradict the ITCZ mechanism61,62. Finally, ITCZ shifts caused by interhemispheric heating imbalances are more linked to ocean-heat transport, which is not applicable here due to considerable differences in timescales. A plot of the modelled global precipitation anomaly can be found in the supplement (Figure 2-S), wherein it is possible to observe a lack of precipitation responses that would indicate a modelled ITCZ shift.
Other potential mechanisms, such as the IOD (Indian Ocean Dipole)63 (“Explained: What Factors Led to India Witnessing Its Hottest and Driest August in 122 Years?” Ashmita Gupta, The Times of India, (archived) https://web.archive.org/web/20230908235312/https://weather.com/en-IN/india/news/news/2023-09-08-why-did-india-witness-its-hottest-and-driest-august-in-122-years) and the NAO (North Atlantic Oscillation), are also unlikely to have played a major role. The IOD’s influence on monsoon dynamics is generally weak during El Niño years64, and its positive index in August 202365 should have increased precipitation, yet this did not occur. NAO-MJO interactions, which could modulate monsoon precipitation66,67, would require positive NAO indices, yet observed data shows predominantly negative values leading up to the anomaly68.
Discussion
In this work, we have tested the hypothesis that the 2023 Canadian extreme wildfire emissions can indirectly contribute to Indian rainfall anomalies of similar record-breaking magnitude to those found in August 2023 by weakening the monsoon westerlies through wind patterns generated by a pressure gradient, which was in turn created by smoke-related cooling in the Eurasian region. Overall, the pressure gradient mechanism hypothesis reasonably maps with measurements. The modelled precipitation anomaly pattern and intensity are a good match with measurements and reanalysis, while both the modelled wind velocity anomaly and cloud cover anomalies match just as well. The model data does also seem to suggest that an MJO shift towards a phase favouring a decrease in precipitation did occur, and that this was produced via the induced pressure gradient which intensified the northern part of the MJO’s Rossby component, thus decreasing the propagation speed of the MJO. These point to a robust connection between the introduction of Canadian wildfire emissions and the Indian monsoon precipitation anomaly of August 2023, which is mediated by a main and secondary mechanism.
It has previously been shown that the Indian monsoon can respond to changes in anthropogenic aerosols across the NH25, however, in this study we show that emissions following significant wildfire events in the NH can affect the Indian monsoon in the same manner. While there exists a 1-month bias between model and measurement in terms of the occurrence of the precipitation anomaly, this can be attributed to differences in initialization data and known model deficiencies. Temporal differences between the model anomaly and the measured anomaly cannot exclude the fact that our experiments show a plausible mechanism for an extreme monsoon anomaly. Future research could focus on investigating historical links between past significant wildfire events in the NH and irregularities in the Indian summer monsoon to strengthen the argument presented in this work. More models could be co-opted for such studies to foster modelling diversity. Finally, given an established solid link between extreme NH wildfire emissions and monsoon drying events, a more operative approach could be taken by suggesting anticipatory and preparatory measures for the regions of India in case of such extreme events.
Methods
Model configuration
The study employs the standard EC-Earth3-AerChem general circulation model (GCM) configuration, which integrates an atmospheric component (“Integrated Forecasting System cycle 36r4”, IFS 36r4), an ocean component (“Nucleus for European Modelling of the Ocean 3.6”, NEMO 3.6), and an atmospheric chemistry component (“Tracer Model 5”, TM5)32,69. This configuration was among the eight EC-Earth3 model setups that participated in the Coupled Model Intercomparison Project Phase 6 (CMIP6)32. For this study, two sets of model experiments covering the period from May to December 2023 were conducted, each consisting of 10 ensemble members. The first set included the 2023 Canadian wildfire emissions as input (hereafter referred to as the “FIRE” simulation), while the second excluded them (“noFIRE”). The results presented in this work are derived from the means of these ensembles. To introduce variability, individual ensemble members were initialized from consecutive start dates, with the first member beginning on January 1st, the second on January 2nd, and so forth. Significance stippling represents the application of Student’s t-tests for statistical significance via the SciPy library in Python. For the initialization of the simulation, we used atmospheric and ocean variables for year 2015, due to model data availability restrictions. The fact that we are using initial conditions from a different year to the emissions is expected to have little impact, given the fact that the objective of this study is to establish the potential large-scale effects of emissions of the magnitude of those that occurred in Canada in 2023 in any given year, rather than to specifically model the exact atmospheric conditions of 2023. The ERA5 precipitation climatology used to calculate the 2023 anomaly is constructed by averaging across the 1991-2020 period.
Data availability
All model data generated during this study are publicly available at https://doi.org/10.5281/zenodo.17512125. CMIP6 SSP370 data used to initialize the model as per the specified configuration used in our experiments can be found at https://doi.org/10.22033/ESGF/CMIP6.4885. CAMS GFAS 2023 wildfire emission data are available at https://ads.atmosphere.copernicus.eu/datasets/cams-global-fire-emissions-gfas. Additionally, this study uses Himawari data downloaded from the Data Integration and Analysis System (DIAS) by Japan Agency for Marine-Earth Science and Technology (JAMSTEC). ERA5 precipitation and zonal wind data can be found at https://doi.org/10.24381/cds.f17050d7.
Code availability
The code associated with this study is publicly available at 10.5281/zenodo.17512125. The EC-Earth3 code is available from the EC-Earth development portal for members of the consortium. Permission to access the EC-Earth3 source code can be requested from the EC-Earth community via the EC-Earth website (http://www.ec-earth.org/) and may be granted if a corresponding software license agreement is signed with ECMWF.
References
Wang, D. et al. Economic footprint of California wildfires in 2018. Nat. Sustainability 4, 252–260 (2021).
Reid, C. E. et al. Critical review of health impacts of wildfire smoke exposure. Environ. Health Perspect. 124, 1334–1343 (2016).
Voulgarakis, A. & Field, R. D. Fire influences on atmospheric composition, air quality and climate. Curr. Pollut. Rep. 1, 70–81 (2015).
Lasslop, G., Coppola, A. I., Voulgarakis, A., Yue, C. & Veraverbeke, S. Influence of fire on the carbon cycle and climate. Curr. Clim. Change Rep. 5, 112–123 (2019).
Jain, P. et al. Drivers and impacts of the record-breaking 2023 wildfire season in Canada. Nat. Commun. 15, 6764 (2024).
Byrne, B. et al. Carbon emissions from the 2023 Canadian wildfires. Nature 633, 835–839 (2024).
MacCarthy, J., Tyukavina, A., Weisse, M. J., Harris, N. & Glen, E. Extreme wildfires in Canada and their contribution to global loss in tree cover and carbon emissions in 2023. Glob. Change Biol. 30, e17392 (2024).
Clair, B. et al. Climate change more than doubled the likelihood of extreme fire weather conditions in eastern Canada. Scientific report of Grantham Institute for Climate Change. Imperial London College, pages 1–26 (2023).
MERRA-2 tavg1 2d slv Nx: 2d,1-Hourly, Time-Averaged, Single-Level, Assimilation, Single-Level Diagnostics V5.12.4. https://doi.org/10.5067/VJAFPLI1CSIV.
Intergovernmental Panel on Climate Change (IPCC). Technical Summary. In: Climate Change 2021 – The Physical Science Basis: Working Group I Contribution to the Sixth Assessment Report of the Intergovernmental Panel on Climate Change. Cambridge University Press, 33–34 (2023).
Popescu, A. et al. Spreading like wildfire: The rising threat of extraordinary landscape fires-A rapid response assessment (USGS Publications, 2022).
Wu, C. et al. Historical and future global burned area with changing climate and human demography. One Earth 4, 517–530 (2021).
Meinshausen, M. et al. The shared socio-economic pathway (SSP) greenhouse gas concentrations and their extensions to 2500. Geoscientific Model Dev. 13, 3571–3605 (2020).
Wu, D. et al. Contrasting Responses of Smoke Dispersion and Fire Emissions to Aerosol-Radiation Interaction during the Largest Australian Wildfires in 2019–2020. Environ. Sci. Technol. 59, 1724–1736 (2025).
Rovithakis, A. & Voulgarakis, A. Wildfire aerosols and their impact on weather: A case study of the August 2021 fires in Greece using the WRF-Chem model. Atmos. Sci. Lett. 25, e1267 (2024).
Li, F. et al. Evaluation of global fire simulations in CMIP6 Earth system models. Geosci. Model Dev. Discuss. 17, 8751–8771 (2024).
Rantanen, M. et al. The Arctic has warmed nearly four times faster than the globe since 1979. Commun. Earth Environ. 3, 168 (2022).
Kashiwase, H., Ohshima, K. I., Nihashi, S. & Eicken, H. Evidence for ice-ocean albedo feedback in the Arctic Ocean shifting to a seasonal ice zone. Sci. Rep. 7, 8170 (2017).
Voulgarakis, A. et al. Interannual variability of tropospheric trace gases and aerosols: The role of biomass burning emissions. J. Geophys. Res.: Atmospheres 120, 7157–7173 (2015).
Van der Werf, G. R. et al. Global fire emissions and the contribution of deforestation, savanna, forest, agricultural, and peat fires (1997–2009). Atmos. Chem. Phys. 10, 11707–11735 (2010).
Liu, L. et al. A PDRMIP multimodel study on the impacts of regional aerosol forcings on global and regional precipitation. J. Clim. 31, 4429–4447 (2018).
Lodh, A. Simulating the impact of extended desertification on Indian hydro climate using ICTP-RegCM4. 4.5. 10 model. J. Hydrol. 598, 126405 (2021).
Lodh, A. & Haldar, S. Investigating the impact of tropical deforestation on Indian monsoon hydro-climate: a novel study using a regional climate model. Nat. Hazards 120, 11399–11431 (2024).
Santra, S., Verma, S., Patel, S., Boucher, O. & Roxy, M. K. Aerosols drive monsoon rainfall spatial modulations over the Indian subcontinent: anthropogenic and dust aerosols impact, mechanism, and control. EGUsphere 2025, 1–26 (2025).
Shawki, D., Voulgarakis, A., Chakraborty, A., Kasoar, M. & Srinivasan, J. The South Asian monsoon response to remote aerosols: global and regional mechanisms. J. Geophys. Res.: Atmospheres 123, 11–585 (2018).
Shindell, D. T., Voulgarakis, A., Faluvegi, G. & Milly, G. Precipitation response to regional radiative forcing. Atmos. Chem. Phys. 12, 6969–6982 (2012).
Bollasina, M. A., Ming, Y. & Ramaswamy, V. Anthropogenic aerosols and the weakening of the South Asian summer monsoon. Science 334, 502–505 (2011).
Andreae, M. O. & Merlet, P. Emission of trace gases and aerosols from biomass burning. Glob. Biogeochemical Cycles 15, 955–966 (2001).
Akagi, S. K. et al. Emission factors for open and domestic biomass burning for use in atmospheric models. Atmos. Chem. Phys. 11, 4039–4072 (2011).
Seinfeld, J. H. & Pandis, S. N. (2016). Atmospheric chemistry and physics: from air pollution to climate change. John Wiley & Sons.
Roșu, I. A. et al. Large-scale impacts of the 2023 Canadian wildfires on the Northern Hemisphere atmosphere. npj Clean. Air 1, 22 (2025).
Döscher, R. et al. The EC-earth3 Earth system model for the climate model intercomparison project 6. Geosci. Model Dev. Discuss. 15, 2973–3020 (2022).
Review of Seasonal Forecast of Monsoon 2023, Sreejith O. P., Scientist & Head, Climate Monitoring and Prediction Group, Climate Research and Services, IMD, Pune, India Meteorological Department, https://www.imdpune.gov.in/imsp/presentations/18/AMW_2024_LRF_sreejith_18_March_2024.pdf.
Lenka, S., Gouda, K. C., Devi, R. & Joseph, C. M. Dynamical influence of MJO phases on the onset of Indian monsoon. Environ. Res. Commun. 5, 061006 (2023).
Saith, N. & Slingo, J. The role of the Madden–Julian Oscillation in the El Nino and Indian drought of 2002. Int. J. Climatol.: A J. R. Meteorological Soc. 26, 1361–1378 (2006).
The ERA5 OLR MJO Index, “Daily MJO index time series from 1979”, accessed at https://psl.noaa.gov/mjo/mjoindex/omi.era5.1x.webpage.4023.txt.
Mahendra, N., Chilukoti, N., Chowdary, J. S. & Renuka, S. A case study of deviant El Niño influence on the 2023 monsoon: An anecdote involving IOD, MJO and equivalent barotropic Rossby waves. Clim. Dyn. 62, 7185–7205 (2024).
Turner, A. G., Joshi, M., Robertson, E. S. & Woolnough, S. J. The effect of Arabian Sea optical properties on SST biases and the South Asian summer monsoon in a coupled GCM. Clim. Dyn. 39, 811–826 (2012).
Chakraborty, A. & Agrawal, S. Role of west Asian surface pressure in summer monsoon onset over central India. Environ. Res. Lett. 12, 074002 (2017).
Kumar, K. N. et al. Unraveling Subseasonal Drought Dynamics in India: Insights from NCMRWF Extended Range Prediction System. J. Hydrometeorol. 25, 1191–1207 (2024).
Raghuvanshi, A. S. & Agarwal, A. Complex network reveals propagation and moisture dynamics of Indian monsoon precipitation extremes. Clim. Dyn. 63, 443 (2025).
University of Wyoming, College of Engineering, Department of Atmospheric Science, Atmospheric Soundings Repository, https://weather.uwyo.edu/upperair/sounding.html.
Thapliyal, R. The monsoon low-level jet: Climatology and impact on monsoon rainfall over the west coast and central Peninsular India. J. Meteorological Res. 37, 112–125 (2023).
Sagalgile, A. et al. Variability of low-level jet over the Arabian Sea and its association with Indian summer monsoon rainfall. Clim. Dyn. 62, 1–13 (2024).
Sagalgile, A. P. et al. Indian summer monsoon sub-seasonal low-level circulation predictability and its association with rainfall in a coupled model. Pure Appl. Geophysics 175, 449–463 (2018).
Entry Terminal JP Himawari Datasets, Data Integration and Analysis Systems (DIAS), https://data.diasjp.net/dl/storages/filelist/dataset:245.
JMA Himawari Meteorological Data Center, https://www.data.jma.go.jp/mscweb/en/product/product_ASWind.html.
Kim, D. et al. A Numerical Analysis of the Changes in O3 Concentration in a Wildfire Plume. Remote Sens. 14, 4549 (2022).
Nandini, G., Vinoj, V. & Pandey, S. K. Arabian Sea Aerosol-Indian Summer Monsoon Rainfall Relationship and its Modulation by El-Nino Southern Oscillation. npj Clim. Atmos. Sci. 5, 25 (2022).
Filonchyk, M. & Peterson, M. P. Changes in aerosol properties at the El Arenosillo site in Southern Europe as a result of the 2023 Canadian forest fires. Environ. Res. 260, 119629 (2024).
Wang, B. et al. Dynamics-oriented diagnostics for the Madden–Julian oscillation. J. Clim. 31, 3117–3135 (2018).
Jiang, X., Maloney, E. & Su, H. Large-scale controls of propagation of the Madden-Julian Oscillation. npj Clim. Atmos. Sci. 3, 29 (2020).
Wang, B. & Chen, G. A general theoretical framework for understanding essential dynamics of Madden–Julian oscillation. Clim. Dyn. 49, 2309–2328 (2017).
Back, S. Y., Kim, D. & Son, S. W. MJO Diversity in CMIP6 Models. J. Clim. 37, 4835–4850 (2024).
Lin, Q. J., Mayta, V. C. & Adames Corraliza, ÁF. Assessment of the Madden-Julian Oscillation in CMIP6 models based on moisture mode theory. Geophys. Res. Lett. 51, e2023GL106693 (2024).
Haertel, P. Prospects for erratic and intensifying Madden-Julian oscillations. Climate 8, 24 (2020).
Chen, Z. et al. Eastward-shifting boreal summer intraseasonal oscillation amplifies North America heatwave and wildfire risks in warming climate. npj Clim. Atmos. Sci. 8, 317 (2025).
Dey, A. et al. The intraseasonal fluctuation of Indian summer monsoon rainfall and its relation with monsoon intraseasonal oscillation (MISO) and Madden Julian oscillation (MJO). Theor. Appl. Climatol. 148, 819–831 (2022).
Richardson, T. B. et al. Drivers of precipitation change: An energetic understanding. J. Clim. 31, 9641–9657 (2018).
Voigt, A. et al. Fast and slow shifts of the zonal-mean intertropical convergence zone in response to an idealized anthropogenic aerosol. J. Adv. Modeling Earth Syst. 9, 870–892 (2017).
NOAA NCEI, “August 2023 Global Climate Report”, accessed at https://www.ncei.noaa.gov/access/monitoring/monthly-report/global/202308.
Asian Disaster Reduction Center (ADRC), Disaster Information Archive, “Bangladesh: Flood: 2023/08/07”, accessed at https://www.adrc.asia/view_disaster_en.php?NationCode=&Lang=en&Key=2632#:~:text=On%207%20August%202023%2C%20heavy,injured%2C%20and%20damaged%20718%20houses.
Kumar, P., Hamlington, B., Cheon, S. H., Han, W. & Thompson, P. 20th century multivariate Indian Ocean regional sea level reconstruction. J. Geophys. Res.: Oceans 125, e2020JC016270 (2020).
Ashok, K., Guan, Z. & Yamagata, T. Impact of the Indian Ocean dipole on the relationship between the Indian monsoon rainfall and ENSO. Geophys. Res. Lett. 28, 4499–4502 (2001).
NASA, Jet Propulsion Laboratory (JPL), Vital Signs, “Sea Level Key Indicators”, “Indian Ocean Dipole”, accessed at https://sealevel.jpl.nasa.gov/data/vital-signs/indian-ocean-dipole/.
Barnes, E. A., Samarasinghe, S. M., Ebert-Uphoff, I. & Furtado, J. C. Tropospheric and stratospheric causal pathways between the MJO and NAO. J. Geophys. Res.: Atmospheres 124, 9356–9371 (2019).
Shao, X., Song, J. & Li, S. The lagged connection of the positive NAO with the MJO phase 3 in a simplified atmospheric model. Theor. Appl. Climatol. 135, 1091–1103 (2019).
NOAA NCEI, “North Atlantic Oscillation (NAO)”, accessed at https://www.ncei.noaa.gov/access/monitoring/nao/.
Van Noije, T. et al. EC-Earth3-AerChem, a global climate model with interactive aerosols and atmospheric chemistry participating in CMIP6. Geosci. Model Dev. Discuss. 14, 5637–5668 (2021).
Acknowledgements
This work was supported by computational time granted from the National Infrastructures for Research and Technology S.A. (GRNET S.A.) in the National HPC facility - ARIS - under project ID FirePC (pr017) and FirePC2 (pr018). The present work was funded through the AXA Research Fund (project “AXA Chair in Wildfires and Climate”, CPO00163217) and of the Leverhulme Trust (grant no. RC-2018-023) through the Leverhulme Centre for Wildfires, Environment and Society, along with the project “Support the upgrading of the operation of the National Network on Climate Change (CLIMPACT)” of the General Secretariat of Research and Technology (grant no. 2023ΝΑ11900001). Further support for this research was obtained through the Hellenic Foundation for Research and Innovation (Grant no. 3453), and from the Horizon Europe programme under Grant Agreement No. 101137680 via project CERTAINTY (Cloud-aERosol inTeractions & their impActs IN The earth sYstem).
Author information
Authors and Affiliations
Contributions
I.A.R. developed the initial hypothesis, produced the model runs, wrote most of the code associated with the research, wrote the main manuscript text, produced the figures. R.N.M. assisted with the technical aspect of the model runs, helped with the code associated with the research, assisted the production of the model runs, facilitated the organization of the involved datasets and methods. M.K. provided conceptual advice and model expertise, provided manuscript redaction advice, analysed the figures. M.P.P. provided manuscript redaction advice, assisted in the improvement and production of the figures, assisted in data analysis. A.V. supervised the research, provided conceptual advice and model expertise, provided manuscript redaction advice, analysed the figures, validated the research conclusions. All authors have read and approved the manuscript. All authors reviewed the manuscript and contributed significantly to the finalization of this research.
Corresponding author
Ethics declarations
Competing interests
The authors declare no competing interests.
Additional information
Publisher’s note Springer Nature remains neutral with regard to jurisdictional claims in published maps and institutional affiliations.
Supplementary information
Rights and permissions
Open Access This article is licensed under a Creative Commons Attribution-NonCommercial-NoDerivatives 4.0 International License, which permits any non-commercial use, sharing, distribution and reproduction in any medium or format, as long as you give appropriate credit to the original author(s) and the source, provide a link to the Creative Commons licence, and indicate if you modified the licensed material. You do not have permission under this licence to share adapted material derived from this article or parts of it. The images or other third party material in this article are included in the article’s Creative Commons licence, unless indicated otherwise in a credit line to the material. If material is not included in the article’s Creative Commons licence and your intended use is not permitted by statutory regulation or exceeds the permitted use, you will need to obtain permission directly from the copyright holder. To view a copy of this licence, visit http://creativecommons.org/licenses/by-nc-nd/4.0/.
About this article

Cite this article
Roșu, IA., Mourgela, RN., Kasoar, M. et al. Severe rapid indian monsoon weakening due to emissions from extreme Canadian wildfires. npj Nat. Hazards 3, 19 (2026). https://doi.org/10.1038/s44304-026-00184-w
Received:
Accepted:
Published:
Version of record:
DOI: https://doi.org/10.1038/s44304-026-00184-w
