Table 2 Performance comparison of micro-average C-indexes for seven models on seven cancer types based on a different number of genes selected by CWx.
Model | 6407 | 3000 | 2000 | 1000 | 500 | 196 | 144 | 100 | 81 | 49 | 25 | Average |
|---|---|---|---|---|---|---|---|---|---|---|---|---|
CNN-Cox | 0.6441 | 0.6742 | 0.6860 | 0.6803 | 0.6816 | 0.6861 | 0.6797 | 0.6801 | 0.6770 | 0.6716 | 0.6704 | 0.6755 |
1D-CNNCox | 0.6438 | 0.6739 | 0.6857 | 0.6813 | 0.6741 | 0.6859 | 0.6789 | 0.6771 | 0.6770 | 0.6682 | 0.6647 | 0.6737 |
NN-Cox | 0.6288 | 0.6492 | 0.6625 | 0.6652 | 0.6606 | 0.6741 | 0.6686 | 0.6572 | 0.6553 | 0.6481 | 0.6485 | 0.6562 |
RSF | 0.6468 | 0.6624 | 0.6683 | 0.6736 | 0.6722 | 0.6817 | 0.6789 | 0.6761 | 0.6774 | 0.6748 | 0.6703 | 0.6711 |
GBM | 0.6254 | 0.6428 | 0.6557 | 0.6552 | 0.6742 | 0.6722 | 0.6683 | 0.6670 | 0.6527 | 0.6559 | 0.6501 | 0.6563 |
Cox-EN | 0.6375 | 0.6901 | 0.6885 | 0.6744 | 0.6326 | 0.6589 | 0.6553 | 0.6589 | 0.6650 | 0.6661 | 0.6667 | 0.6631 |
SSVM | 0.6383 | 0.6923 | 0.6939 | 0.6698 | 0.6111 | 0.6180 | 0.6113 | 0.6395 | 0.6514 | 0.6586 | 0.6675 | 0.6502 |
- Bold values facilitate the rapid identification of the optimal performance survival analysis moder under different experimental conditions, that is, with different number of selected gene features.
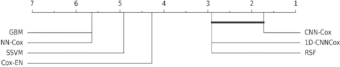
- Friedman test was performed on micro-average C-indexes of seven models on seven cancer types, BLCA, SKCM, KIRC, LGG, HNSC, LUAD, and LUSC. FF = 9.7206 is far greater than the critical value 2.2541 at α = 0.05 significance level, showing seven models perform significantly differently. The post-hoc Bonferroni–Dunn test was conducted for paired comparisons of CNN-Cox against other baseline models. Critical difference (CD) diagram for test results is shown, where x axis denotes average ranks. If the rank difference between the two methods is smaller than CD = 2.490, performance difference is not significant (horizontal line). Except 1D-CNNCox and RSF, CNN-Cox has significantly better performance than other models.