
Fig. 2: Sensitivity plots of psychosis classification performance when tested on independent internal (left; i.e.., cross-validation) and external (right) datasets.
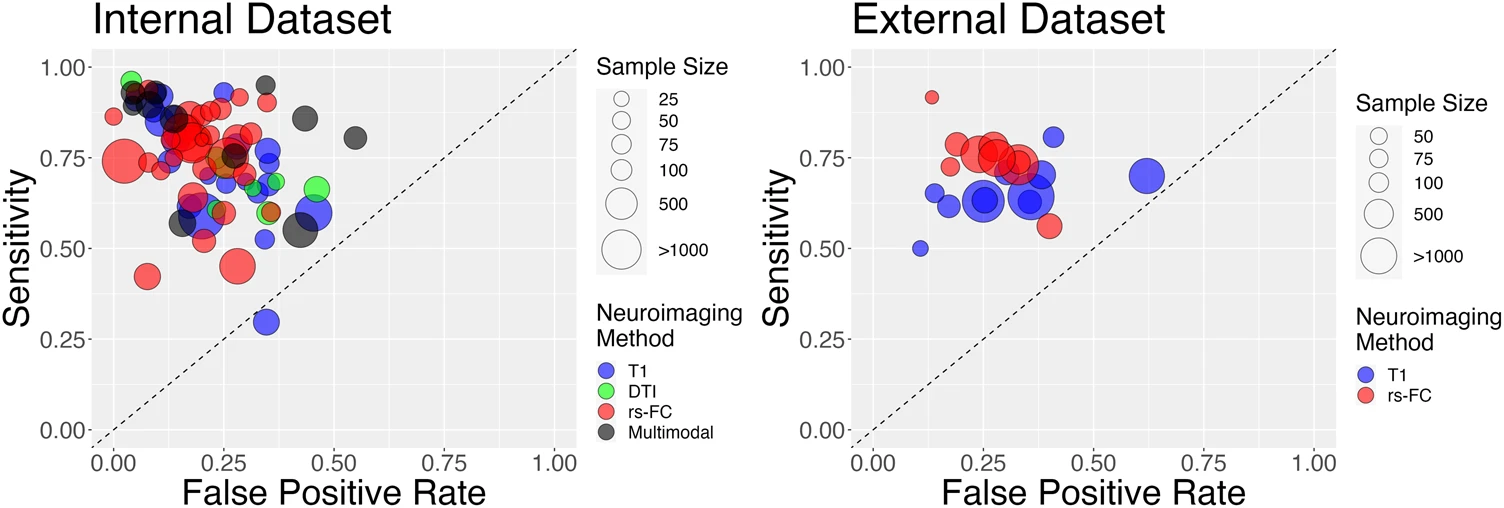
Sensitivity and specificity scores were derived using data from the classifier in each manuscript. All manuscripts were able to reliably differentiate participants with psychosis from healthy controls independent of neuroimaging type aside from [169]. The size of points is scaled according to sample size and modality of analysis is shown in various colors.
