
Correction to: Acta Pharmacologica Sinica https://doi.org/10.1038/s41401-024-01307-7, published online 11 June 2024
-
1.
Page 3: The Publishers would like to apologize for the errors in the publishing process of this article. The released article is not the final version. In the description of Fig. 1, we found inaccuracies. The corrected sentence would be “whereas the administration of THBru subsequently improved hypertrophy. After 12 weeks of treatment, the db/db mice progressed to severe heart failure (Fig. 1a), as indicated by decreased EF%, FS%, E/A ratio, and increased IVRT (Fig. 1b–e)”.
-
2.
Page 5: The HE staining in the MET group presented incorrect accidentally in Fig. 1f. The inaccuracy was due to an oversight during the preparation of the figures. The authors have carefully checked the raw data and corrected the accidentally confused image.
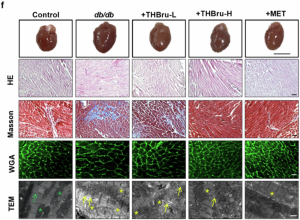 f Histopathological changes and collagen deposition were assessed by H&E (magnification 200×, Scale bar:100 μm), Masson trichrome (magnification 200×, Scale bar:100 μm), WGA (magnification 200×, Scale bar:100 μm), and electron microscopy. The green arrow indicates normal sarcomeres, the yellow arrows indicate abnormal sarcomeres, green asterisk indicates normal mitochondria, yellow asterisk indicates mitochondrial swelling (Scale bar: 10 μm).
 -
3.
Page 8: The scale bar for Fig. 4b was mistakenly presented. It was corrected into (magnification 100×, scale bar: 20 μm).
-
4.
Figure legends for supplementary figures:

Fig. S1 SERS analysis of THBru.
Fig. S2 THBru improves cardiac hypertrophy in db/db mice. (a) Representative echocardiographic images showing the echocardiograms for assessment of cardiac function in db/db mice. (b) Statistical results for EF%. n = 5. (c) Statistical results for FS%. n = 5. (d) Body weight changes of mice were recorded during 12 weeks of administration. n = 5. e Blood glucose changes of mice were recorded during 12 weeks of administration. n = 5. ###P < 0.001 vs. control; *P < 0.01, **P < 0.01, ***P < 0.001 vs. db/db. The data are expressed as the mean ± SEM.
Fig. S3 MD simulations of docking complex. (a) RMSD of the ligand reflects the stability of the THBru. (b) RMSF reflects the flexibility and fluctuation of the amino-acid residues of docked complexes.
Fig. S4 RAGE regulates PI3K/AKT/NF-κB pathway in cardiomyocytes treated with high glucose. (a) Western blot analysis of the protein level of RAGE in NMCMs. n = 3. (b-g) Western blot analysis of the protein level of phosphorylation (p-) and total PI3K, AKT, and NF-κB. n = 3. *P < 0.01, **P < 0.01 vs. HG. The data are expressed as the mean ± SEM.
Fig. S5 Inhibition of NF-κB reverses the effects of overexpressed RAGE. (a, b) Immunofluorescence staining of NMCMs for α-actinin (green) and nucleus (blue) is labeled by DAPI. (magnification 400×, scale bar:20 μm). (c) Representative images of ROS production in NMCMs. (magnification 100×, Scale bar:20 μm). n = 5. ***P < 0.001 vs. HG; &&&P < 0.001 vs. HG + RAGE. The data are expressed as the mean ± SEM.
Fig. S6 RAGE regulates PI3K/AKT/NF-κB pathway in cardiomyocytes. (a) GO results indicated THBru binding protein. (b) Protein-protein interaction (PPI) network analysis created by the STING database.
Fig. S7 THBru inhibits NF-κB nuclear translocation. (a, b) Immunofluorescence staining of NMCMs for NF-κB (red), and nucleus (blue) is labeled by DAPI. (magnification 630×, scale bar:10 μm). n = 5. ###P < 0.001 vs. control; ***P < 0.001 vs. HG. The data are expressed as the mean ± SEM.
The original article has been corrected.
Author information
Authors and Affiliations
Corresponding authors
Rights and permissions
About this article

Cite this article
Xu, Hh., Hao, Sx., Sun, Hy. et al. Author Correction: THBru attenuates diabetic cardiomyopathy by inhibiting RAGE-dependent inflammation. Acta Pharmacol Sin 46, 1795–1796 (2025). https://doi.org/10.1038/s41401-025-01483-0
Published:
Version of record:
Issue date:
DOI: https://doi.org/10.1038/s41401-025-01483-0
